


"All warfare is based on deception"
Abstract
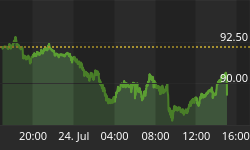
March 6, 2006 was not the best of days for the precious metals. Gold was down $10.60 to $555.90. Silver was down 0.20 to $10.00. Both moves were just under a 2% fall for the day. As we stated in this weekends market wrap:
"Notice the cluster of prices around the 570 level back in the beginning of February. Gold will soon have to get above this resistance level if its upward rally is to stay alive. We are not of the opinion that gold must make a new high to remain in a strong bull market; however, it must soon make up its mind, which way it goes from here."[1]
It appears that gold made up its mind today, although one day does not a trend make. As always, confirmation is required. We have the feeling that it will be forthcoming, but not necessarily immediately. The downside move was not unexpected, as:
Last week we also said: "The gold stocks outperformed the physical by over 4 to 1 - a good showing. We mentioned last week that we would be watching this ratio closely - we did and it has performed admirably. As of now the charts hint at further upside action towards the old high from January."
"Well we got it half right. Physical gold was up as noted for the week. The XAU Index, however, was down -2.39%. For the week, the gold stocks under-performed the metal. This bears very close watching. If the divergence increases, the rally may be nearing its end."[2]
Today the divergence picked up its pace. Gold was down as we said, just under 2% for the day. The XAU closed at 132.57 down -4.58 for 3.33% on the day. The XAU is also well below its 50 dma at 138.79.
Perhaps this will be all there is to the downside, however, as we have said, we believe that gold and the precious metals stocks are closer to an intermediate correction than to an intermediate advance. They have not experienced an intermediate term correction since May of 2005.
We agree with Mike Bolser that pure technical analysis in today's market is not enough. One needs to be aware that the powers that be greatly intervene within the markets.
This does not mean that technical analysis cannot be used - just that it can't be used by itself, just as interventional analysis alone cannot be used alone. We need to use all tools available: technical, fundamental, interventional, and contrarian.
XAU INDEX
Chart Courtesy of StockCharts.com
Intermediate Trend
We note that the 200 dma is at 110.82. If an intermediate term correction is at hand that is where support needs to hold, between the cluster at 105-110. As long as a higher low is kept intact, the gold bull is still alive. We still believe that there is much more to the gold bull as we stated last November (2005): The Charts Are Talking. Who's Listening?
Below is the point and figure chart for the XAU, which shows the most probable direction of future price action. The operative word is probable. The level projected is once again: approximately 110. Moreover, this does necessarily mean immediately, as in tomorrow.
There is the short term, the intermediate term, and the long term. They are of ascending importance.
XAU Index Point & Figure Chart
Chart Courtesy of StockCharts.com
Probability vs. Reality
The above projection is by no means a given, it is, however, becoming increasingly more probable by the day. We would not at all be surprised to see one more thrust up before the downside objective becomes closer to reality than probability. We still feel as we did in the February 2006 follow-up to the charts are talking: The Charts Are Talking: Is Anyone Listening?
Long Term Trend
Comex Gold
Chart Courtesy of Comex
"Please note - the above chart is a very long-term chart that goes back decades ago, yet it can and does come into play in today's gold market.
The above chart shows a high of 873 back in 1980 - 26 years ago. Gold then declined to 252.50 in August of 1999: 19 years after the high and 6 years ago since the low.
If we take the high of 873 and subtract the low of 252.50, we get a total decline of 620.50. A 50% retracement gives 620.50 divided by 2 = 310.25.
Take the low of 252.50 and add the 50 percent retracement (310.25 + 252.50) = 562.75. The market is just below this area of long-term resistance.
This is evidence that an intermediate term correction from these levels would not be a major surprise, nor from keeping with ordinary market action. A watchful eye is warranted."[3]
Gold Bull Still Strong
Even if an intermediate term correction occurs, such would just be normal market price action. As long as a higher low is made, the gold bull remains alive and well.
Gold Weekly
Chart Courtesy of StockCharts.com
Notice the cluster of price action in the middle of the chart between 410-415. Unless that level is breached, we remain undaunted.
We agree with Mike Bolser: the enemy is "strongest when they appear weakest and weakest when they appear strongest." Such is wise advice during a war.
Markets are always at a high just before they fall. Markets are always at a low just before they rise. Buy into weakness and sell into strength. Let your opponent make the first move that starts his downfall.
"The art of war is of vital importance to the State."[4]
[1] Honest Money Gold & Silver Report Week ending 3/03/2006
[2] Honest Money Gold & Silver Report Week ending 2/24/2006 & Week ending 3/03/2006
[3] Honest Money Gold & Silver Report Week ending 2/24/2006
[4] Sun Tzu - The Art of War - Art of War by SunTzu [SunZi] -English Hypertext


