In his multipart essay 'The Phantom Cartel' [1], author Mark Taylor, also known as 'Zorro', offers an interpretation of COT data gathered during the initial days of the suppression in gold prices. Without attributing a source, he takes up my thesis that systematic pressure on gold prices began on August 5th, 1993. While ignoring all my statistical findings supporting a concerted effort to keep prices down, Taylor attempts to counter the argument by analysing COT data.
In a typical and statistically significant way, the price of gold often dropped during the New York session. Following this anomaly, it was possible to pin-point the date when the suppression started [2]. This finding was confirmed in several instances. For example, during the last FOMC meeting before the suppression started, FED-Governor Angell said: 'We can hold the price of gold very easily' [3].
The beginning of the suppression on August 5, 1993 was typical for the many that followed. Firstly, it was during New York trading hours. Secondly, it was done with a sudden, huge sell-off. But who was selling? Obviously not the central banks directly, but private companies such as the bullion banks borrowing gold from the central banks. Zorro however says that 'commercial traders' are also 'accused' of this manipulation. Thus he suggests a close connection between the suppressors on one side and the commercials in the COT report on the other.
Every week, large participants are required to state their position in the futures market. Position sizes of the three main groups are reported in total; for the 'commercials', e.g. mining companies, for the 'non commercials', e.g. institutional traders (among them many hedge funds), and for the 'non reportable', e.g. small traders. Zorro's reasoning is that many contracts must be sold to suppress the price of gold. He thinks those contracts should appear in the COT report as an increase of the net short positions of the commercials. However that was not the case; in fact the number fell. Zorro concludes that there was no price suppression. Does his conclusion hold? Some thoughts:
- There is no public knowledge of whether, or alternatively, under which COT category the orders of the suppressing bullion banks are reported. The 'Phantom Cartel' wants its actions to go unnoticed, probably because they believe interventions work better if nobody knows about them, thus they will make an effort to cover their actions.
- But even while adhering to CFTC rules, a suppression account may be listed in groups other than the commercials, for instance in the non-commercials. This group includes all large institutional positions which are only used for standard trading purposes - a cartel member could fit perfectly into this group. Indeed, the non-commercials increased their number of net short contracts in the week price suppression started with 27,231, contrary to the position of the commercials.
- But even if they were reported under the commercials, other commercial participants could have been buyers. The COT data does not distinguish between 'Phantom-Cartel' members or others.
- We must also consider, that the suppressors can cause stop loss selling of members in other groups, and then buy back their previously sold contracts.
- Generally, the COT data is not exact enough for the purpose of analysing the start of a suppression scheme. The report states a decrease of the net short position of 48,686 contracts between August 3rd and August 10th. However, the suppression started on August 5th, and we do not have COT data for this particular day - not to mention data for specific trades in order to conduct a detailed analysis.
- On the other hand, we do have the volume and open interest data for this day. According to CRB [4], 127,207 contracts were traded on August 5th, the highest volume until then. So the volume during just one day was far more than the decrease of the number of net short positions of the commercials over the entire week (48,686).
- For details' sake, saying that the suppressions took place mainly during Comex trading hours does not mean that they were done only through Comex. There are also other large markets such as Forex, OTC, options, which are interconnected.
We must consider the above items; the COT data does not offer a direct measure of the activities of the 'Phantom Cartel' and therefore does not counter the suppression thesis.
On the other hand, there is an anomaly that gold prices fall far more often during the New York session than during the remainder of the day. For instance, the number of days with falling prices in New York and rising prices during the remainder of the day was, until 2001, more than twice as high as the opposite [5] . This anomaly however is a direct outcome of the suppression because any kind of suppression influences price directly.
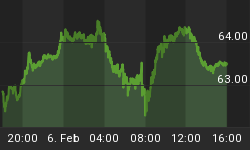
Furthermore, the anomaly occurs very often and thus is of statistical significance. The chart shows an average of intraday gold price movements of all days over a period of several years and clearly depicts the occurrence.

Lastly, there are several other findings, many of them published by Gata [6].
While spuriously thinking the COT data offers proof against the suppression, Zorro completely ignores all evidence supporting the suppression. This also includes my own statistical analysis, even if he uses the resulting beginning day, August 5th 1993. On that day, prices dropped during the Comex session 'in a matter of seconds at one point' [7]. Since then, most market observers have seen this happen again and again. It is not 'normal' market behaviour; it is the implementation of FED-Governor Angell's idea to 'hold the price of gold'.
Sources:
[1] www.safehaven.com/archivedetails.cfm?id=85
[2] www.gold-eagle.com/editorials_01/speck022301.html
[3] www.gold-eagle.com/editorials_03/speck020303.html
[4] www.crbtrader.com/infotech.asp
[5] www.gold-eagle.com/editorials_01/speck051001.html
[6] www.gata.org
[7] Daily Telegraph, August 6th, 1993
PS: I have decided not to wait for part three of Zorro's article with my reply, as he plans to look at dates other than August 5th, 1993.


