


The good news is:
• The Russell 2000 (R2K), S&P Mid cap and AMEX composite hitall time highs last week while the NASDAQ composite (OTC), S&P 500 (SPX)and Wilshire 5000 hit multi-year highs last week.
It is beginning to look like the spring of 2000, technology, telecom, retail and reits are hot while the usual leader at tops, the Dow Jones Industrial Average (DJIA) is struggling.
Short term
Net Field Trend (NFT) is calculated by subtracting the number of issues in an index with negative field trends from those with positive field trends and expressing the result as a percent of total issues in the index. The field trend is positive when the previous two On Balance Volume (OBV) highs and two OBV lows have been progressively higher. The field trend is negative when the previous OBV two highs and two OBV lows have been progressively lower.
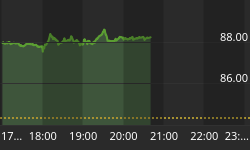
The chart below shows the R2K in red and NFT calculated from the component issues of the R2K in blue, the dashed horizontal line represents 0 or neutral for NFT. NFT was falling as the R2K hit an all time high last week and is now negative.

Intermediate term
In late 1998, when stocks and bonds became uncoupled, NYSE breadth data became unreliable as an analytic tool. Although I remain suspicious, stocks and bonds have been re-coupled for several years.
The chart below shows the SPX in red and a 10% trend of NYSE new lows on an inverted Y axis (NY NL) in brown. The indicator was falling (increasing new lows) while the index was hitting a multi year high. This pattern is often seen at market tops.
There were 103 new lows on the NYSE Friday. Prior to 1998 any number greater than 40 would have been viewed with concern. Some comfort might be taken in the composition of Friday's NYSE new low list as most of the issues were preferred and other interest rate sensitive stocks.
For the time being NYSE new lows should not be ignored.

Seasonality
Next week can be viewed from at least two seasonal perspectives. The week includes the 4 trading days before Good Friday and since Good Friday can occur between mid March and late April a more generic perspective as the week prior to the 2nd Friday of April.
Last week the market continued to follow the average seasonal pattern very closely with leadership reversing and the blue chips outperforming the secondaries.
The week prior to Good Friday has had a very pronounced pattern with Monday usually weak, Tuesday neutral and Wednesday and Thursday strong.
The week prior to the 2nd Friday in April has been stronger during the 2nd year of the Presidential cycle than the average of all years combined. The past 20 years or so have been weaker than the earlier periods.
4 days before Good Friday
The number following the year represents its positionin the presidential cycle.
The number following the daily return represents theday of the week;
1 = Monday, 2 = Tuesday etc.
| OTC Presidential Year 2 | |||||
| Year | Day4 | Day3 | Day2 | Day1 | Totals |
| 1966-2 | 0.32% 1 | 0.43% 2 | 0.39% 3 | 0.83% 4 | 1.97% |
| 1970-2 | -0.56% 1 | 0.24% 2 | 0.46% 3 | 1.66% 4 | 1.80% |
| 1974-2 | -0.86% 1 | 0.29% 2 | -0.34% 3 | -0.09% 4 | -1.00% |
| 1978-2 | 0.40% 1 | -0.32% 2 | 0.13% 3 | 0.22% 4 | 0.43% |
| 1982-2 | 0.93% 1 | 0.26% 2 | 0.69% 3 | 0.69% 4 | 2.58% |
| Avg | 0.05% | 0.18% | 0.27% | 0.66% | 1.15% |
| 1986-2 | -0.52% 1 | -0.38% 2 | 0.36% 3 | 0.73% 4 | 0.20% |
| 1990-2 | -0.17% 1 | 0.40% 2 | 0.38% 3 | 0.64% 4 | 1.25% |
| 1994-2 | -1.40% 1 | -2.23% 2 | -1.37% 3 | -0.19% 4 | -5.19% |
| 1998-2 | -1.42% 1 | -1.66% 2 | 0.46% 3 | 0.73% 4 | -1.89% |
| 2002-2 | -2.10% 1 | 0.64% 2 | 0.14% 3 | 1.02% 4 | -0.30% |
| Avg | -1.12% | -0.64% | -0.01% | 0.59% | -1.19% |
| OTC summary for Presidential Year 2 1966 - 2002 | |||||
| Averages | -0.54% | -0.23% | 0.13% | 0.62% | -0.02% |
| %Winners | 30% | 60% | 80% | 80% | 60% |
| MDD 3/31/1994 5.10% -- 4/7/1998 3.06% -- 3/25/2002 2.10% | |||||
| OTC summary for all years 1963 - 2005 | |||||
| Averages | 0.16% | 0.31% | 0.26% | 0.37% | 1.10% |
| % Winners | 51% | 60% | 67% | 74% | 60% |
| SPX Presidential Year 2 | |||||
| Year | Day4 | Day3 | Day2 | Day1 | Totals |
| 1954-2 | -0.04% 2 | -0.40% 3 | 0.14% 4 | 0.36% 5 | 0.07% |
| 1962-2 | -0.44% 1 | 0.44% 2 | 0.54% 3 | 0.47% 4 | 1.02% |
| 1966-2 | 0.91% 1 | 0.61% 2 | 0.27% 3 | 0.22% 4 | 2.01% |
| 1970-2 | -0.08% 1 | 1.14% 2 | 2.03% 3 | 0.17% 4 | 3.26% |
| 1974-2 | -1.05% 1 | 0.63% 2 | -0.23% 3 | -0.30% 4 | -0.95% |
| 1978-2 | 0.69% 1 | -1.13% 2 | -0.36% 3 | -0.12% 4 | -0.93% |
| 1982-2 | -0.34% 1 | 0.55% 2 | 0.09% 3 | 0.66% 4 | 0.96% |
| Avg | 0.03% | 0.36% | 0.36% | 0.12% | 0.87% |
| 1986-2 | 0.85% 1 | -0.26% 2 | 1.10% 3 | 0.70% 4 | 2.40% |
| 1990-2 | 0.38% 1 | 0.21% 2 | -0.04% 3 | 0.71% 4 | 1.25% |
| 1994-2 | -0.13% 1 | -1.63% 2 | -1.53% 3 | 0.05% 4 | -3.24% |
| 1998-2 | -0.12% 1 | -1.06% 2 | -0.71% 3 | 0.83% 4 | -1.06% |
| 2002-2 | -1.47% 1 | 0.58% 2 | 0.53% 3 | 0.25% 4 | -0.10% |
| Avg | -0.09% | -0.43% | -0.13% | 0.51% | -0.15% |
| SPX summary for Presidential year 2 1954 -2002 | |||||
| Averages | -0.07% | -0.03% | 0.15% | 0.33% | 0.39% |
| %Winners | 33% | 58% | 58% | 83% | 58% |
| MDD 3/30/1994 3.26% -- 4/8/1998 1.88% -- 3/23/1978 1.61% | |||||
| SPX summary for all years 1953 - 2005 | |||||
| Averages | 0.04% | 0.16% | 0.07% | 0.24% | 0.51% |
| % Winners | 47% | 55% | 54% | 65% | 67% |
The week prior to the 2nd Friday in April
| OTC Presidential Year 2 | ||||||
| Year | Mon | Tue | Wed | Thur | Fri | Totals |
| 1966-2 | 0.30% | 0.20% | -0.33% | 0.10% | 0.32% | 0.59% |
| 1970-2 | -0.27% | -0.23% | -1.39% | -0.40% | -0.31% | -2.60% |
| 1974-2 | -0.41% | 1.02% | 0.43% | 0.20% | -0.65% | 0.59% |
| 1978-2 | 0.28% | -0.08% | 0.40% | 1.03% | 1.18% | 2.80% |
| 1982-2 | -0.14% | -0.07% | -0.19% | 0.39% | 0.62% | 0.61% |
| Avg | -0.05% | 0.17% | -0.22% | 0.26% | 0.23% | 0.40% |
| 1986-2 | -0.68% | 1.14% | 0.07% | 0.80% | 0.46% | 1.79% |
| 1990-2 | 0.09% | -0.29% | -0.90% | -0.58% | -0.75% | -2.43% |
| 1994-2 | -0.08% | -1.19% | -1.60% | -0.01% | 0.09% | -2.79% |
| 1998-2 | 0.26% | 0.99% | 1.10% | -0.27% | 0.45% | 2.53% |
| 2002-2 | 0.89% | -2.42% | 1.41% | -2.37% | 1.79% | -0.70% |
| Avg | 0.10% | -0.36% | 0.02% | -0.49% | 0.41% | -0.32% |
| OTC summary for Presidential Year 2 1966 - 2002 | ||||||
| Avg | 0.02% | -0.09% | -0.10% | -0.11% | 0.32% | 0.04% |
| Win% | 50% | 40% | 50% | 50% | 70% | 60% |
| OTC summary for all years 1963 - 2005 | ||||||
| Avg | 0.01% | -0.09% | -0.12% | 0.17% | -0.20% | -0.24% |
| Win% | 63% | 53% | 53% | 58% | 58% | 60% |
| SPX Presidential Year 2 | ||||||
| Year | Mon | Tue | Wed | Thur | Fri | Totals |
| 1930-2 | -0.51% | -0.55% | 1.61% | 0.19% | -0.31% | 0.44% |
| 1934-2 | -0.46% | 1.47% | -0.09% | -0.27% | -0.36% | 0.29% |
| 1938-2 | -0.22% | 2.60% | -2.22% | -0.76% | 4.57% | 3.98% |
| 1942-2 | 0.00% | -1.63% | -0.26% | 0.13% | -1.53% | -3.30% |
| 1946-2 | 0.43% | 1.40% | -0.37% | -0.21% | 0.00% | 1.24% |
| 1950-2 | 0.11% | 0.84% | 0.11% | -0.66% | 0.17% | 0.56% |
| 1954-2 | 0.18% | -0.92% | 0.37% | 1.00% | 0.73% | 1.36% |
| 1958-2 | 0.62% | 1.02% | -0.78% | 0.36% | 1.09% | 2.31% |
| 1962-2 | -0.77% | 0.37% | -0.22% | -1.02% | 0.28% | -1.37% |
| Avg | 0.12% | 0.54% | -0.18% | -0.11% | 0.57% | 0.82% |
| 1966-2 | 0.03% | -0.37% | 0.10% | 0.36% | 0.13% | 0.25% |
| 1970-2 | -0.70% | -0.27% | -0.03% | 0.05% | -0.33% | -1.29% |
| 1974-2 | -0.08% | 1.75% | 0.75% | 0.45% | -1.09% | 1.78% |
| 1978-2 | 0.35% | -0.27% | -0.16% | 0.97% | 2.13% | 3.03% |
| 1982-2 | -0.19% | -0.01% | -0.14% | 0.45% | 0.40% | 0.51% |
| Avg | -0.12% | 0.17% | 0.10% | 0.45% | 0.25% | 0.86% |
| 1986-2 | -0.03% | 2.14% | 0.10% | 1.15% | -0.20% | 3.16% |
| 1990-2 | 0.12% | -0.02% | -1.15% | -0.77% | -0.88% | -2.70% |
| 1994-2 | 0.62% | -0.51% | -0.29% | 0.03% | -0.04% | -0.20% |
| 1998-2 | -0.09% | 0.54% | 0.32% | -0.99% | 1.31% | 1.09% |
| 2002-2 | 0.23% | -0.67% | 1.13% | -2.37% | 0.66% | -1.01% |
| Avg | 0.17% | 0.30% | 0.02% | -0.59% | 0.17% | 0.07% |
| SPX summary for Presidential Year 2 1930 - 2002 | ||||||
| Avg | -0.02% | 0.36% | -0.06% | -0.10% | 0.37% | 0.53% |
| Win% | 50% | 47% | 42% | 58% | 56% | 68% |
| SPX summary for all years 1928 - 2005 | ||||||
| Avg | 0.00% | -0.02% | 0.01% | 0.09% | -0.17% | -0.10% |
| Win% | 53% | 50% | 47% | 51% | 53% | 53% |
Conclusion
Most of the short term indicators have headed south. Seasonally the first two days of the week are weak while the two days ahead of Good Friday are usually strong.
I expect the major indices to be lower on Thursday April 13 than they were on Friday April 7.
Last week the blue chip indices were up while the small cap indices were down so I am calling last weeks positive forecast a tie.
This report is free to anyone who wants it, so please tell your friends. They can sign up at: http://alphaim.net/signup.html. If it is not for you, reply with REMOVE in the subject line.


