


"Sapiens dominabitur astris."
Introduction
The present paper is going to concentrate on the precious metals almost exclusively. We shall also look at interest rates in the bond market, as we believe there is an important relationship between the precious metal markets and the bond market.
The bond market dwarfs all other markets in size except the forex market, which is the largest market in the world. We are talking about the U.S. bond market - not the global bond market.
The U.S. bond market backs Federal Reserve Notes - our paper fiat currency. The issuance of U.S. Treasury Bonds/debt is the fodder from which Federal Reserve Notes rise.
These are the same Federal Reserve Notes that we exchange with China and Japan to purchase their exports to us with - which they in turn use to buy U.S. Treasury debt. It is a most unique and fascinating arrangement to say the least. It reminds us of the word: symbiotic - as with a parasite and its host.
Interest Rates
U.S. Bonds - or obligations of debt as it were - pay interest rates to the holders (buyers) of the debt. This is another fascinating arrangement: the government sells debt that others purchase by lending Federal Reserve Notes to the government.
These are the same Federal Reserve Notes backed by the same Treasury Bonds. They are the same Treasury Bonds the Fed uses to create Federal Reserve Notes with.
If you can follow that, you are doing quite well - as it still seems incredibly unbelievable to me - and God knows I have tried to understand it. Sometimes I wonder if mere mortals can understand it.
Conundrum
As we have discussed in Gold Wars: Gibson's Paradox & The Gold Standard and other papers - there is a relationship between interest rates, bonds, and gold. What that relationship is depends on when you are looking at it.
Before 1995, when interest rates went down and money supply was easy - the price of gold would rise. Interest rates and gold moved opposite to one another. Once the economy overheated the Fed would raise interest rates in response to rising price inflation. Higher interest rates would slow the economy down, and with it the price of gold.
Suddenly around 1995 this relationship reversed: as interest rates went down the price of gold went down with them. This anomalous conundrum had all but the wisest of monetary wizards wondering what was up. One thing was certain: it was not the price of gold.
Why do we mention this arcane topic, arguably best left for the new world order architects of structured finance? Because suddenly interest rates are rising and so is the price of gold. It appears that Gibson's Paradox still lives on - at least it would seem. However, appearances can be deceiving.
Before we show a chart of presently rising interest rates, we want to first show a longer-term chart of interest rates. It shows the relentless and prolonged period of falling interest rates the Fed has engineered.
Ten-Year T-Note Yields
As the above chart clearly illustrates - the Fed has been on a campaign to continually lower interest rates in what appears to be a Sisyphean slope to Hades. Now it appears that the slope is about to be broken. A change in trend may be about to occur - or is it?
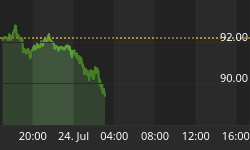
The next chart shows the recent rise in interest rates associated with the ten year Treasury note. Ten-year yields have breached the 5% level for the first time since 2002.
Ten-Year Treasury Note Yield
The Jokester
The Jokester loves to play jokes. He enjoys confusing others by employing tricks of all persuasions. His favorite is the art of illusion.
How does one go about catching the jokester? The best way to catch him is by thinking as he does, and using that to turn the tables.
We have said and we still say - the Fed does not want the long end of the bond market to experience rising yields. If the bond market gets into trouble - the real estate market will not be far behind.
The real estate market is the crazy glue that is holding the house of cards together. Even Mr. Magoo does not want to prick the housing bubble, which is teetering on top of the debt bubble.
Somebody Is Wrong
Before 1995, if interest rates started to rise - gold would go down. Conversely, if interest rates went down, gold would go up. Gold and interest rates had an inverse relationship, they moved in opposite directions.
This is fundamentally understandable. Gold is real money. Paper fiat debt-money is just what the name says: debt. It is not real money. When interest rates go down - bonds go up in value.
Bonds are another form of paper debt, so it makes sense that if paper debt obligations are going up in value, then real money that is not debt, i.e. gold, would go up in value.
At least it made sense until 1995. Suddenly the inverse relation turned 180 degrees. As we have seen by the above chart of interest rates - yields kept going down - relentlessly.
The price of gold should have been going up; instead, it kept going down - relentlessly. If ever there was a conundrum, this was it.
Now that interest rates are going up, according to pre 1995 parameters, gold should be going down - instead it is going up. According to post 1995 parameters gold should be going up and it is.
One of the two would appear to be wrong: either gold or bond yields. However, perhaps there is more to all this than meets the eye at first blush. Perhaps either the pre or the post parameters of the relationship between interest rates and gold are wrong.
Intervention
What happened in 1995 that turned the interest rate/gold ratio upside down? Intervention 21st century style is what happened. Derivatives are what happened. Structured finance is what happened. Suddenly black was white and white was black.
The Red Queen didn't know what to do. She said to go ask Alice, when she's ten feet tall. And how happy were the people - when they printed them all: tens, twenties, hundreds, and even thousands of thousands stacked so tall.
It was intervention by the Fed and other central bankers that affected the market to reverse a long-standing inverse ratio between gold and interest rates. Lending support were the mega international players: the World Bank, the IMF, and the BIS.
We offer one of many quotes from Gold Wars: Intervention and Manipulation that illustrates the hand at play:
J. Virgil Mattingly's 1995 statement to the FOMC:
"It's pretty clear that these ESF (exchange stabilizing fund) operations are authorized. I don't think there is a legal problem in terms of the authority. The statute [31 U.S.C. s. 5302] is very broadly worded in terms of words like 'credit' -- it has covered things like the gold swaps -- and it confers broad authority."
Gold stands in the way of irresponsible bankers that will inflate and inflate, continually debasing and devaluing our currency of its purchasing power. Gold is the ever-watchful sentinel that gives first warning of the banker's misdeeds.
The bankers know this - it is why they fear and shun gold. It keeps them honest, healthy, and wise. However, their desires seek out other shores more distant and alluring. The pull of nature is too strong - and they are too weak.
As we stated in Gold Wars: Intervention and Manipulation during a conference organized by the World Gold Council in Paris on November 19, 1999, Robert Mundell, Professor at Columbia University and 1999 Nobel Prize Laureate in Economics, made the following remarks during the question and answer session after his speech on "The International Monetary System at the Turn of the Millennium":
"Gold is subject to a lot of elements of instability, not the least of which is the attempt on the part of several big governments to make it unstable. [...] If you notice what happened in the past 20 years in government policy in respect to gold, nobody sold gold when the price was soaring to $800 an ounce. It would have been a good deal and it would have been stabilizing if they would have done so. But people sell it when it hits bottom; the British have been selling gold now that it seems to have hit the very bottom. That element - governments selling when the price is low or not selling when the price is high - makes it destabilizing. Governments should [...] buy low and sell high."
If interest rates have been manipulated downward since 1995, and with them the price of gold, then it would seem to make perverted sense that now thatinterest rates are going up - that gold should go up as well.
Therefore, does it still hold water that either gold or interest rates are wrong? Maybe - maybe not: maybe both.
Which relationship is right - should bonds and gold march together or in opposite directions? In addition, might the present relationship change again in the future?
I believe that those capable of such wizardry have persuaded interest rates to steadily fall as the charts indicate. Consequently, the long existing inverse ratio between gold and interest rates no longer holds sway - at least perhaps for a bit longer.
Now gold is rising with interest rates. I do not believe the Fed and company want the long end of the yield curve to rise. It will destroy what has taken them decades to pull off. It might even destroy the real estate market and with it the economy.
We have a dilemma: just what is the Fed up to? Do they want an inverted yield curve as we have repeatedly stated? Has the Fed lost control? Perhaps they no longer have the power to persuade interest rates to heed their beck and call.
The most horrid of possibilities is that rising interest rates are the desired choice. Perhaps a big hit to the real estate market is in order, as who forecloses on the property?
Who gets to keep whatever monies have been paid to date, and now gets to confiscate the property as well. A piece of property that cost him nothing to lend the money to, and which he can now lend to another - ad infinitum.
Reversion
A few rare individuals study and write daily about the Fed's intervention. I believe they are correct in their basic premise. Nevertheless, I offer a somewhat different take on some of the subtle nuances that may be hiding in the tall grass.
Presently I still stand behind the belief that the Fed does not want the long end of the yield curve to rise. In my opinion, the Fed wants an inverted yield curve. This will allow for the short end of the market to rise, providing the smoke and mirrors needed as a diversion to obfuscate their profligate creation of tons and tons of paper fiat debt-money.
The most probable way to accomplish this is by persuading energy, commodities, and the precious metals to go down in price. The BIS has a 1.5 TRILLION dollar derivative interest rate position. That is some serious money - even for make-believe money, especially when highly leveraged.
Ask Long Term Capital Management - they were experts at sophisticated hedges. I never understood why they chose that name - it just didn't seem to go with their modis operandi, which was to lose all the capital as quickly as possible.
If the Fed chooses to act as above, this would provide the illusion of the dreaded d-word: deflation. This would give the Fed their excuse to lower interest rates and create reams of money to act as the liquidity and a rising tide that keeps things floating.
In the aftermath of Katrina, the price of natural gas was supposedly headed for the moon. Every reason in the world was given why there would be massive shortages this winter and skyrocketing prices for both natural gas and oil.
In January of 2006 we wrote in Black Gold: U.S. Dollar Hegemony
"Suddenly in November of 2005, the Federal Reserve gave its Approval of proposal by JPMorgan Chase & Company (click link for Fed Document of approval) "for commodity trading activities, including physical transactions in energy-related ... JPM Chase also must notify the Federal Reserve Bank of New York..."
Even more sudden was the 40% drop in natural gas prices. Do not underestimatethe power of the establishment. They are not the establishment by accident.
It looks like they can go one last round, however, they have spent a good deal of their financial ammunition. They are in retreat to higher ground tomake one last stand.
I am of the opinion, and it is just an opinion, as there are no facts to inconvertibly prove the supposition; nevertheless, they will be successful this time around, and will indeed persuade the markets to concur one last time.
After this is anyone's guess. I believe that due to all the intervention; all the creation of paper fiat debt-money; all the leveraged loans made to finance and refinance real estate; and especially because of the colossal derivative positions now in place - that there is coming a time when interest rates will go up, yet the dollar will go down.
Bonds will be going down and the real estate market with it. The stock market will be quick to join the party - it may even set it off. Hopefully it does not happen, cause it could get messy.
Below are several charts of gold and silver, and various indexes of related stocks. There is also a fascinating chart of the Dow/Gold ratio for the past 200 years. The basic premise behind these charts is that we are closer to an intermediate term correction in the gold and silver markets, as compared to the start of a new intermediate term up leg.
A short-term spike may still occur. The long and short of it is that we believe that within the next six months the precious metals and related stocks will be able to be bought at much lower prices.
All bets are off, however, if war or other exogenous 10 sigma-like events occur. A new world order now exists - at least for the short term. Nevertheless, when the perfect comes - the imperfect shall cease to be.
Gold Daily Continuous
The above chart shows gold to be overbought, however, that is what bull markets do. They can stay overbought for quite awhile.
We are still of the opinion that the rally is getting a bit long in the tooth and frothy.
Next, we have the five-year chart of gold, which shows that gold has broken out of its channel of several years in the making.
Gold Weekly 5-Year Chart
The PPO at the bottom shows a very high reading. Histograms at the bottom are just nudging over the zero line. Stochastics are very high as well.
Next up is silver. Its rise is getting near parabolic now. It still can go up, however, the risk to reward appears to be favoring the side of risk being greater at this time.
Silver Daily Continuous
The five-year chart of silver shows an even more parabolic rise. All the indicators on the chart show an overbought or nearly overbought level. Caveat Emptor is all we can add.
Silver Weekly
Continuous 5 Year Chart

The chart of Newmont is one of the most troubling. It is the leader of the pack as they say. Yet, while gold has been setting 20+ year highs, Newmont has fallen considerably and has under performed the rest of the market.
Newmont Mining Corp.
The charts of the XAU leave a bit to be desired. Last week the XAU had a reversal down, which didn't look too good. It has recovered somewhat, however, it is still under performing.
XAU Gold & Silver Index
Weekly
The XAU daily shows the dominant markers on the chart. Many are flashing caution.
XAU Gold & Silver Index
Daily
Lastly, we have the Dow/Gold ratio going back 200 years. This is a most interesting chart, as it shows the relation of the Dow to Gold.
We are presently lowering the ratio, which means the industrials are under performing compared to gold. Richard Russell believes that before all is said and done - that the ratio will return to near 1 to 1. We concur and add - that is a scary thought.
Dow/Gold Ratio
Conclusion
We are nearer to an intermediate term correction in the precious metals and related stocks then to the beginning of a new intermediate term leg up. Several markets are presently at key pivot points: gold, silver, precious metal stocks, commodities, energy, interest rates, and the overall stock market.
That all these markets are sitting at such crucial junctures is an amazing coincidence.
Interest rates APPEAR to be breaking out. The Fed is going to take at least one last stand to stave off the onslaught of gold and silver. It remains to be seen if the Fed can pull it off. To do so will delay a further rise in long term interest rates - for the short term - if they still have the power.
In the not too distant future, the precious metal stocks will be much cheaper than they presently are. A bit further down the road all major markets: U.S. bond, stock, currency, real estate, and interest rates will all be aligned and headed down.
Gold and silver will be the only asset rising. The saber rattling on the news is meant to be an affect that makes an effect of large proportions. The Fed is painting itself into a corner but as wild animals behave in such situations, it seems to be preparing to launch a last offensive.
The Fed and all may well be trying to lure market players into untenable positions that cannot remain supported from such pivotal levels. Once the illusionary support is withdrawn - the markets thus set up - will fall hard. Natural gas is a perfect example.
As we quoted the Governor of the Bank of England in Gold Wars: Gibson's Paradox & The Gold Standard:
"We looked into the abyss if the gold price rose further. A further rise would have taken down one or several trading houses, which might have takendown all the rest in their wake."
"Therefore, at any price, at any cost, the central banks had to quell the gold price, manage it. It was very difficult to get the gold price under control but we have now succeeded."
It appears da boyz still play with their little toys - not fully cognescient of the power and responsibility of their actions.
The gold and silver bull markets are alive and well. They will remain so. Intermediate term corrections actually make them stronger. Positions move from weak hands to stronger hands. Higher lows form and build a stronger base from which the next assault to new highs occurs.
In a gold bull market, the higher lows are more important than the higher highs. As long as higher lows remain in place - higher highs will naturally follow.
Back in November of 2005, we wrote The Charts Are Talking. Who's Listening? At that time, we showed a bevy of cup and handle formations that appeared to be indicating that a breakout in the gold and silver stocks was most probable.
The XAU was at 110 the HUI at 231. On February 2, 2006, we penned another paper titled: The Charts Are Talking: Is Anyone Listening? At that time the HUI was at 340 - today it is at 348.
We stated that the markets were just beginning to get a bit frothy and warranted the awareness of such.
"That is what disciplined traders do during rallies in bull markets: they sell into strength, and buy during weakness. This is how one prospers in a gold war. If further upside action occurs, we will continue to do the same with a minimum of one third, and a maximum of two thirds, of our trading portfolio.
That does not mean that a correction is going to start tomorrow, as once again, no one can predict the future. What it does mean is that to stay disciplined and focused, by selling into strength, and buying on weakness - that is what matters: money management and asset allocation."
Our position remains the same. We have repeatedly sold into new highs and near new highs As of now we are sitting on the sidelines waiting for a much better entry point that we believe will be coming for the gold and silver stocks.
Since we place booked trading profits into accumulating physical gold and silver we are quite content, especially as we said months ago - it looked like silver was poised to outperform gold and we favored silver. Silver cooperated nicely.
Lastly, we agree with Michael Bolser - this is a Gold War. They have once confiscated all personal gold holdings, and at another time reneged on paying their contractual obligations to foreign nations to settle their account balances with gold bullion as they had pledged. This was Nixon's contribution to worldbetterment.
Gold is strong and gold will win this war, but remember all great warriors learn to retreat during certain battles - to regroup and become stronger to return another day - to win the war. Even Shaka Zulu used the deadly effectiveness of this ploy. Caveat Emptor. Expect the unexpected and be prepared.
"The wise shall exercise dominion over the stars."
Come visit our new website: Honest Money Gold & Silver Report
And read the Open Letter to Congress


