


CNBC EUROPE
Last week we discussed how weak trends can be resolved to the direction of the weak trend and produce fast move or they can reverse. But either way weak trends are followed by fast moves.
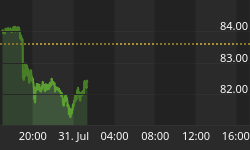
LET'S LOOK AT THE U.S. DOLLAR INDEX

You can see there has been a weak trend down since the March high, so the obvious thing is to look for a low here. Each time the index has broken below a previous low it has immediately rallied back to almost the previous high, which is showing the characteristics of a weak trend. So there is now a 5 wave structure down and a bounce up from the "obvious" support of the previous low but has yet in two days of rally managed to trade much above that previous low. If that is the entire rally the index can show from the "obvious" support and complete wave structure down then this weak trend down is going to turn into a fast or even a panic move down. If it can show a higher low, then the move down is complete and it will be back at the March high in the blink of an eye. So this will be a critical weak for currencies and we can look for a fast move to develop.
LET'S LOOK AT THE FTSE DAILY CHART

Last week the FTSE was at a critical point within it up trend. If it could have moved below the low of the 12th it would have given an indication of trending down after a weak move up and a one-day counter trend rally would be a solid indication. That movement would have put the entire up trend at risk. But the index went up the next day and was at a new high two days later. So now the question becomes is this a possible "false break" pattern and the index will find high on Monday and reverse or is this going to be resolved to the upside and show an exhaustion or vertical move upward as the forecast for the US Stock Market. Because the last low did not get down to the trendline (bullish) and has left a space between the previous high and the last support, a vertical move up is still possible. Today is a short-term cycle for high and should be viewed as resistance but the pattern of trend indicates no problem, yet. If that resistance can be overcome by moving higher past the cycle-then a vertical move up is very likely.
LET'S LOOK AT THE S&P 500 INDEX

Just as the FTSE the S&P 500 was at a critical point within the trend but was at a more definable low due to the trendline from lows to lows. So the move up was likely but whether this is now the start of the final multi-month exhaustion move to this bull campaign I had forecast 4 months ago has yet to be proven. But it is now at a point within the "pattern of trend" that may tell the story for the remainder of the year. You can see this has been a weak trend since January. A low on top of this congestion would signal the final exhaustive move up is in progress. But now there is a marginal new high within a weak uptrend so the risk is a false break and a correction. If the correction exceeds three days, there could be a problem with the weak trend. If there is a correction from here it will be the last attempt at low to start an exhaustion move up.
CNBC ASIA
LET'S LOOK AT THE US $ INDEX

Last week we discussed how weak trends could be resolved in the direction of the weak trend and produce a fast move. The U.S. Dollar Index has been moving down with a struggle. You can see there has been a weak trend down since the March high. Each time the index has broken below a previous low it has immediately rallied back to almost the previous high, which is showing the characteristics of a weak trend. So there is now a 5 wave structure down and a bounce up from the "obvious" support of the previous low but has yet, in two days of rally, managed to trade much above the previous low. If that is the entire rally the index can show from the "obvious" support and complete wave structure down then this weak trend down is going to turn into a fast or even a panic move down. If it can show a higher low, then the move down is complete and it will be back at the March high in the blink of an eye. So this will be a critical week for currencies relative to the U.S. dollar. I have no idea what could be the catalyst for a panic move down but the charts indicate that is a distinct probability-now.
LET'S LOOK AT THE NIKKEI

Previously I indicated the last move down in the index would not exceed 4 trading days down. The index went down 4 days and should have resumed the uptrend. It is now 4 days up after the low and still not moved above the high of the 4-day decline. This has me worried because of the 90/180-day cycle that just expired. On my April 3rd CNBC Report I told you to be cautious of April 20th as it could set up as a high. If the index moves below the "4-day low" it will put the short-term up trend in doubt. This may depend upon how the Dollar gets resolved this week. Please understand there is no evidence of a problem with the trend yet other than not reaching a new high within 4 days after a four day decline and the probability from cycles. But that does create some risk.
LET'S LOOK AT A DAILY ALL ORDS AUSTRALIAN INDEX

For the past two months I've been forecasting the index would exhaust up into the 19th of April for a possible top of some consequence. The index did exhaust with a large gap up into the 19th as forecast. But the move down so far has not done any damage to the trend as it has even held the previous swing high, which has kept the blowoff intact and this morning it rallied 40 points. The next point in "time" to bring in a high is not until May 19th and could be part of a further exhaustion from here or the end of a sideways distribution pattern that could starting now.
To a technician like myself this trend has been a thing of beauty a "Mona Lisa" of blow off trends. But the completion is getting near. If it can move up past May I will be surprised. But there is no evidence yet my forecast for a top on the 19th is valid other than the short-term exhaustion. More evidence is needed to come to a conclusion about this time window.


