


The smelling salt, the smelling salt, someone get the smelling salt. So many "investors" fainting from excitement. Get a grip, look at the charts, it's not so bad - yet.
WHAT TO DO? OH, WHAT TO DO?
After a week like last week many speculators (everyone's a speculator) are wondering what to do now. As a pure market technician who doesn't have a clue as to why the markets do what they do my only answer is always follow what the charts tell you. After all, the charts are the daily actions of all the experts in the market. They are most often right but do err on the occasion, no one is perfect. But what to look for? Very briefly, 2 or 3 things.
Trend, always trend. If the trend is not going your way bail out. There are literally dozens of trend indicators one can use. I use more than one but the basic trend indicator would be the moving average line. Above the line is good, below the line is not.
Strength of the trend or price momentum. Again, there are literally dozens of momentum indicators but the one I like best is the Relative Strength Index (RSI). Momentum informs you of the strength of the recent price moves. Positive momentum good, negative momentum bad. Of course there are grey areas such as a decreasing momentum in the positive zone or an increasing momentum in the negative zone. One must do a little bit of brain process.
Volume, the third thing to watch. Daily volume increasing with a rising price good, daily volume increasing with a falling price bad. Lots of nuances in between.
These are the indicators I try to look at each week (plus others but this is not a technical course).
GOLD
LONG TERM

WHAT TO DO? (continued)
Most investors rely upon information and/or recommendations from outside sources, usually their brokers or independent advisory services. As you can imagine these services can be anything from great to disastrous. In the end, as they all will tell you, or should, it is up to you to decide what to do with your investment or speculative capital. You have the final control and RESPONSIBILITY.
Pick your advisor carefully. If you are satisfied with their service, hold on to them. If you are dissatisfied with their service, dump them. It is your capital you are dealing with. And above all be very cautious of those advisors who do not provide you with the information to sell or get out of a losing investment/speculation in a timely manner.
LONG TERM (cont.)
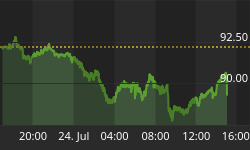
After a week like last week the first thing I do is go to my long term P&F chart and see if there has been any long term damage done. NOPE, at least not yet. Admittedly, the action of the past few weeks has been overdone. That has been noted by the trend going through both the primary and secondary up trend resistance lines (the red ones). This week has brought the action back inside the primary up trend lines. As one can quickly see, and it takes only a second or so, the action has not broken any bullish up trend lines nor has it dropped below two previous lows. Both actions are required for me to declare a trend reversal. The price would have to break below both blue dash lines shown, the horizontal at $620 and the up trend at a slightly lower level. For now there is no need to worry from the long term stand point.
I told you so, I told you so, see, I told you so.
The easiest way to be proven wrong is just to say "I told you so" and see what happens next. However, two weeks ago I had this to say about a potential gold action, " ---- we could expect some still more upside followed by a several week rest period during which time gold will drop some 17% and then see a really, really wild ride to that $1575 projected level.". Well, so far so good. We're into that rest period that might take gold to the $620 to $640 level yet. And then a wild ride. It's during the rest period that one can start getting his act together for the next move. However, one must always remember that forecasting is very, very dangerous and not to take any forecasts as a given. That is why I prefer to wait, most of the time, for a new move to start and be on the right side of things from the start.
As for the basic indicators, the long term is still in good shape. The price is still comfortably above a positive long term moving average line. The long term momentum indicator (the 30 week RSI shown last week) has dropped below the 70% level but is still above that 65% level which has been sort of a trigger line for rest periods that resulted in at least a 10% market correction. The correction has already arrived with an 11% drop from its previous week's high so I expect that the momentum indicator will drop below its 65% level soon and even cross below that up trend line (again, shown last week). I don't expect any dramatic action going forward but who knows, anything can happen. The weekly volume indicator is still in a roaring up trend well above its moving average trigger line.
Putting all of that together I am still BULLISH on the long term.
INTERMEDIATE TERM
Looking at the intermediate term P&F chart we have some conflicting views. The action is still well above its primary intermediate term up trend line, which would be the line from the previous reversal level. The action has broken below a secondary (not official) up trend line and has also broken below two previous lows. The price projection for such break is to the $650 level, which is just about where the price touched on Friday. This secondary action just had no real strength to it. From a P&F stand point there was insufficient time spent at the top to develop any kind of lateral base from where a reasonable reaction could take place. Such reaction might still be forth coming but the P&F was not helpful here.

As for the normal indicators, the price is still above its positive sloping moving average line. Intermediate term momentum is still in the positive zone but moving lower rapidly. It has broken below its several week up trend line as has the price action. The volume indicator has turned down and can be classified more as a neutral indicator than a positive or negative.
When considering all these indicators I come to the conclusion that a NEUTRAL rating is most appropriate. The action has broken many positive barriers but still not enough to reverse to the bear side yet.
SHORT TERM

Short term you want action, you got action, now what?
This was the steepest one week drop in price since the bull market started in early 2001. The turn around may not have come as much of a surprise but I think everyone was surprised at the severity. The move took gold below its short term moving average line with the line turned down. The move also broke below a short term up trend line (the more aggressive one of the two shown, the other is more an intermediate term line). The short term momentum indicator has now crossed its neutral line and is in the negative zone, after breaking a month and a half support on Monday. The volume indicator has also turned down and has crossed below its short term trigger line for a negative signal.
From the short term perspective one must now go to the BEARISH side.
IMMEDIATE TERM
So, what do we have in store for the next day or two? There is nothing encouraging from the indicators. The Stochastic Oscillator has crossed into the negative zone and is showing no signs that the trend is about to reverse. The very short term moving average line was crossed on Monday and the line turned downward at the same time. It has been heading lower ever since. A trend in motion remains in motion until reversal is confirmed, so, I see a continuation of the down trend for at least the next few days, but probably not as severe. One interesting point brought out below when viewing the major gold Indices. They all have what appears to be a one day reversal action and this may reflect upon gold itself. We'll just have to wait and see.
NORTH AMERICAN GOLD INDICES
A devastating week for the major North American Gold Indices. Double digit losses on the week for them all. For the 4 major Indices the losses ranged from a low of 12.2% to a high of 13.0%. All of the Indices have several things in common. They all started their declines on the previous Thursday, a day or two ahead of gold itself. They all have crossed their intermediate term moving average lines and the lines have all turned to the down side. All the intermediate term price momentum indicators are also in their negative zones although some just barely. But most interestingly, they all have actions on Friday that appear to be a prelude to a new advance on Monday and beyond. They have the look of a one day reversal action (see chart).

The AMEX Gold BUGS Index (HUI) is typical of the major Indices action over the past several days. Note the Friday action. A sharp drop and almost a full recovery to close almost at the high for the day. This kind of action is typical of what is referred to as a "one day reversal day". Let's see if it continues to rally on Monday.
MERV'S PRECIOUS METALS INDICES
So, how did the Merv's universe and sector Indices do this past week? They were all bummers, a complete wipe-out. All in the double digit losses. Looking through the years that the universe of 160 has been active, this week is the worst weekly drop since a 20% drop in July of 2002. In 1997 from Oct to Dec the 160 Index dropped 40% without a single positive week. This week may sound bad but it ain't the worst we've ever had. Despite the severe drop this past week the Merv's Indices are still comfortably ahead since the start of the new year. While the major North American Gold Indices are up some 15% to 18% since the start of the year Merv's Qual-Gold, Spec-Gold and Qual-Silver Indices are still up 27% while the Spec-Silver is up 74% and Gamb-Gold is still ahead 85%. The overall universe of 160 stocks is still ahead 40% since the new year. The North American primary market Indices are only at a plus 2% to minus 1% during this same period. Even if you get out here you have a nice profit versus other stock Indices.
From the Gold Indices Page one can see that most of Merv's Indices have now turned NEG in the intermediate term except for a - N in the Gamb-Gold RATE(ing). The long term are still holding at their POS(itive) ratings except for the QUAL-SILVER Index which has turned NEG(ative).
Subscribers who may have accessed the tables on Saturday, The indicator chart in the 4 gold Indices was in error. Shown was a 30 Week RSI but the title mentioned a 13 Week RSI. The Indices were corrected on Sunday morning and now show the 13 Week RSI.
MERV'S GOLD & SILVER 160 INDEX

The overall universe dropped 14.7% during the week. As mentioned above, it wasn't the worst its ever dropped but that doesn't make things any better. There was not a single stock in the whole 160 universe that advanced during the week. 2 stocks ended the week unchanged but 158 stocks declined. A real massacre. The Index dropped below its intermediate term moving average line and the line followed by turning downward. The Index is still some distance above a positive long term moving average line for some saving grace. Both the intermediate and long term price momentum indicators have dropped below their overbought lines and below up trend and support lines but closed the week just above their neutral lines, still in the positive zones.
As for breadth, already mention not a single stock closed the week on the up side for a massacre. As for the overall universe ratings, the short term rating has dropped to a BEARISH 96% while the intermediate term rating dropped from a bullish 65% to a BEARISH 76%. The long term rating was reduced from a bullish 85% to a still BULLISH 62%. There might be some confusion between the Index RATE(ing) shown in the Gold Indices Page versus the ratings I mention in these paragraphs. The Gold Index Page rates the performance of the INDEX itself while the ratings in these paragraphs are the percentage of stocks in the Index that are either rated as POS, NEG or neutral. These are the percentages one will find at the bottom of each individual Index table.
With all the double digit losses on the week (there were 124 losses greater than 10%) there were only 2 that were in the plus/minus over 30% category. The greatest loss was sustained by Yukon Gold which was also on last week's list. One would have been out on last week's action for a minimum 4 ½ month profit of 47%. The chart shows the point at which Yukon Zinc was included in the universe in late Dec but also the point at which it would have initially gone POS in Nov if it had been included.
All in all, a miserable week.

MERV'S QUAL-GOLD INDEX
The Qual-Gold Index dropped 13.4% on the week. Not one stock closed on the up side, 30 stocks (or 100%) closed on the down side. Otherwise, everything mentioned about the 160 Index in the first paragraph applies to this Index also.
As for ratings, the short term has moved into the BEARISH 98% level while the intermediate term has dropped from a bullish 72% last week to a BEARISH 83% this week. Quite a change. The long term rating has moved from a bullish 83% to a neutral rating, neither bullish or bearish (i.e. over 50%).
MERV'S SPEC-GOLD INDEX
The Spec-Gold Index dropped 13.2% on the week. Everything said in the first paragraph of the Qual-Gold Index applies here except that the long term momentum has not yet crossed its up trend line drawn from last May's low.
On the ratings front, similar disasters occurred. The short term rating has dropped to the BEARISH 98% level while the intermediate term has dropped from a bullish 72% to a BEARISH 68%. The long term rating has remained BULLISH but dropped from 88% to 68%.
MERV'S GAMB-GOLD INDEX
The Index most seem to be interested in. The Gamb-Gold Index dropped a miserable 18.2% on the week, the worst of the Merv's Indices. What goes up the most usually drops the most. Gambling has suddenly become more risky then ever. Everything said in the first paragraph of the Qual-Gold Index applies here except that the long term momentum has not yet crossed its up trend line drawn from last May's low but has crossed below a more aggressive up trend line from the Nov low.
On the stock ratings front the short term has dropped to the BEARISH 97% level, a whole 1% better than the rest of the Indices, hallelujah. On the intermediate term the rating has dropped from the bullish 67% level to a BEARISH 80% level while on the long term it has dropped from a bullish 93% to remain BULLISH at 75%.
MERV'S SILVER INDICES
This is where the real beating can be seen. The silver stocks got clobbered as can be expected. They were the darlings since the bottom last May so they had the most to lose. Silver itself fell a whopping 13.2% on the week. The rally in silver over the past few weeks has been on very weak momentum and couldn't hold. This week we had a vertical slide in silver price not unlike the one of a month ago. It now remains to be seen in silver will hold above the $11.60 level it reached a month ago or if it continues dropping. Intermediate term momentum, although moving lower fast, is still above the neutral line inside the positive zone so there is still a little hope that the silver slide is close to an end.
MERV'S QUAL-SILVER INDEX
With a loss this week of 14.6% the Qual-Silver Index became the first of the Merv's Indices to go BEARISH in the Index long term period. All stocks declined on the week. The Qual-Silver Index has now had four weeks on the down side and has now crossed below both the intermediate and long term moving average lines. The long term line is still very slightly pointing upwards but that can't last another down week.
As can be expected, the stock ratings are in the miserable class with the short term at a full 100% BEARISH rating while the intermediate term at only a 95% BEARISH rating. The long term Qual-Silver stock rating is the only one of the Merv's Indices that has already moved into the BEARISH camp with a 55% BEAR rating.
MERV'S SPEC-SILVER INDEX
With a decline of 16.4% the Spec-Silver Index had almost the worst drop of the bunch except for the Gamb-Gold Index. Everything said in the first paragraph of the Qual-Gold section applies here.
For 25 stocks we have a short term rating at 100% BEARISH. On the intermediate term the rating dropped from a bullish 67% to a BEARISH 82%. On the long term the rating is still BULLISH at 56%, down from a bullish 93% last week.
MERV'S PRECIOUS METALS TABLE

Click to open larger image in new window
That's it for this week.


