


Honest Money Gold & Silver Report

Markets around the world are getting increasingly active - volatility is on the rise. Some of this volatility is due to the unwinding of certain carry trades. However, we think there is much more to come regarding the carry trades. These are the just the incipient murmurs.
The yen has been weak of late - suggesting that large positions have not yet been unwound. Such activity would put upward pressure on the yen. There are billions involved in the yen carry trade.
Nevertheless, this is only one side of the carry trade. Commodities are and have been on the other side. If commodity prices fall further, it will put even more pressure on the carry trades, and quite possibly from both sides.
Over-Riding Thought
Within the last few days I have watched a recurring thought swirling about me, as if it was saying "look at me", "pay attention to me". It is an involved thought - so please bear with.
I am fully convinced that the correction in gold and especially in precious metal stocks is an intermediate term correction - not a short-term correction.
Price wise we may be fairly near the bottom - within 10-20%. Regarding the duration or length of time of the correction, we may be a ways from the end - as in a couple of months.
I am heavily of the opinion, although not fully convinced, that the overall stock market is also entering upon an intermediate term correction. If this turns out to be the case - it will add additional risk to the precious metal stocks.
The precious metal stocks are already correcting downward. If the overall market heads downward in earnest it will only add to the existing momentum of the pm stocks to follow the path of least resistance, which as of now is down.
The point being that the precious metal stocks have their own sector risk, and they may have the additional overall market risk occurring at the same time. Caution is warranted. There may be a short-term bounce coming in the pm's, however, it may not last more than a few days.
Interest Rates
One of the main culprits in the recent market weakness has been interest rates. They have been rising around the world in many countries.
U.S. Two-Year Notes Post Biggest Weekly Drop Since March on Rate Outlook
"June 9 (Bloomberg) -- U.S. two-year Treasury notes posted their biggest weekly decline since March as Federal Reserve Chairman Ben S. Bernanke and other officials reinforce the need to keep raising interest rates to combat inflation.
Yields on two-year notes, among the securities most sensitive to changes in monetary policy expectations, rose 8 basis points, compared with a 2 basis point decline on 10-year notes.
Yields were higher on two-year notes than 10-year debt for a second day, known as an inverted yield curve, for the first time since March.
In addition, the same thing is occurring in Europe as well:
European Bonds Post Second Straight Weekly Drop Amid Inflation Concern
June 9 (Bloomberg) -- European government bonds posted a second straight week of declines on concern the region's central bank will fail to raise interest rates fast enough to tackle inflation.
Yields on two-year bonds have risen close to their highest since 2002. European Central Bank President Jean-Claude Trichet yesterday signaled the bank will keep to a pace of raising interest rates by a quarter point every three months. Inflation erodes the value of fixed-income payments.
Even Japan - the land of zero bound interest rates has been raising rates ever so gently. This week saw a reprieve however:
Japan's Bonds Gain This Week as Slump in Stocks Tempers Outlook for Rates
June 9 (Bloomberg) -- Japan's government bonds rose this week after a slide in stocks spurred speculation that the Bank of Japan will refrain from raising interest rates as soon as next month.
Benchmark 10-year bonds had their biggest weekly rally since May 19 as the Nikkei 225 Stock Average completed its worst week since March 2001.
Bank of Japan board members at a meeting on June 14-15 will take into consideration the stock market's recent slide, Economic and Fiscal Policy Minister Kaoru Yosano said today."
We have discussed the fact that we believe that the Fed wants an inverted yield curve. They would rather have short-term rates higher than long-term rates. The reason is that the long end of the yield curve has more of a direct affect on mortgage rates.
If mortgage rates rise, the real estate sector will be in trouble. The Fed does not want to see the real estate market in trouble, as housing has been the glue holding the economy together. If real estate goes - the economy goes with it.
We mentioned many weeks ago that the Dow Utility Average was signaling that interest rates would most likely be on the rise in the coming weeks, as the utility average was rallying the last few weeks, after a significant correction down. Utilities usually give the first warning sign of higher rates.
Utility Average Daily
Housing
The utilities have not been alone in warning that higher interest rates were coming. The Philadelphia Housing Index has been in a protracted decline for many weeks now.
Philadelphia Housing Index
The housing stocks have all been taking it on the chin as of late. This is not a good precursor for the future health of the real estate market.
Earlier this year the Fed had an inverted yield curve. Then for several weeks it dissipated. Now it is back. However, the long end of the bond market appears to be in trouble as the chart below shows.
A short term counter trend bounce is likely, however, long term bonds appear to be approaching a time of rising interest rates that inversely affect their value.
30 - Year T-Bond Yield
Mortgage Defaults and Bankruptcies
Mortgage defaults and bankruptcies are already making the news:
June 9, 2006
CHICAGO -- Foreclosures on home mortgages are on the way up.
"Nationally, foreclosures are up 38 percent, higher than in any quarter of last
year, property tracker RealtyTrac Inc. said.
The numbers are even grimmer in the Midwest. Michigan and Ohio, battered by automotive-related job losses, together recorded 45,000 mortgages entering some stage of foreclosure in the first quarter.
Those are increases of 91 percent and 39 percent, respectively, compared with last year's fourth quarter.
There are many reasons for the growing number of defaults, and there are suggestions that the foreclosure trend may soon worsen.
Layoffs attributable to corporate downsizings, health care issues, increasing debt levels and rising interest rates all are factors.
In addition, a growing number of homeowners are relying on adjustable-rate mortgages, catching some people by surprise when their monthly payment rises.
Significantly, some of those ARMs were offered with an initial three-year to five-year period in which the rate was fixed.
At the end of that period, the mortgages will be reset at prevailing rates, potentially upending borrowers because interest rates have been rising.
For many such people, that moment is approaching.
"The increases we've been seeing in foreclosures don't even reflect the worst-case scenario that could happen when the $2.7 trillion in adjustable-rate mortgages are reset over the next 18 months," said Rick Sharga, vice president of marketing at RealtyTrac."
Stocks
None of this has gone unnoticed from the stock markets around the world. From the US to Europe to the Middle East and India, stock bourses have been taking a pounding as of late.
So far, the Nasdaq has been performing the worst - as expected. However, the S & P 500 is getting very near to a troubled zone.
As the chart below shows - the S&P 500 has bounced off its 200-dma average three times recently, but has now dropped significantly below it.
S&P 500 Index 
World Stock Index
Stock markets around the globe have been taking a beating - from the US to Europe to the Middle East and India. Some markets in the Middle East are down 25-50%, as is Saudi Arabia (-50%).
The chart of the Dow Jones World Index clearly illustrates what has been occurring. It has dropped to its 200 dma and presently sits right on top of it.
MACD and Histograms still pointing down. RSI is testing the 30 level for the second time. At least a dead cat bounce and or a short-term rally sparked by short covering should be due.
Dow Jones World Stock Index
US Dollar
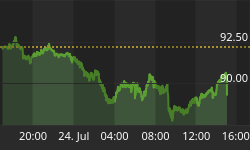
The US Dollar is the biggest and sickest bear market on earth. Nevertheless, this past week has seen what may be the beginnings of a short-term rally. We would not be surprised to see the dollar rally to the 88-90 level.
It is possible that the rally could even turn into an intermediate term rally. At the present time, we cannot tell if this will occur or not. As of now, I favor that it will not occur. Longer term we are extremely bearish on the dollar.
Dollar Registers Its Biggest Weekly Advance Since November Against Euro
"June 9 (Bloomberg) -- The dollar gained this week by the most since November against the euro as Federal Reserve speakers suggested they will raise interest rates this month to keep inflation in check.
Traders pushed the dollar to the highest in a month against the euro after a government report showed U.S. import prices climbed in May. The U.S. currency has rallied five straight days against the euro as mounting expectations for higher U.S. rates led traders to exit bets on a dollar decline. Fed Chairman Ben S. Bernanke led a chorus of central bank officials this week signaling concern over inflation.
"What's given the dollar a lift this week is the Federal Reserve's hawkish campaign," said Marc Chandler, global head of currency strategy at Brown Brothers Harriman & Co. in New York. The remarks fueled "a large-scale unwinding" of holdings in emerging-markets and a flight to the dollar, he said."
The first chart below illustrates why we think a short-term rally is in the offing. A double bottom has been put in on two separate occasions near the 84-price level. The Dollar Index is headed up towards its 50 dm, which is right overhead. The index itself is headed upward not far from its 50 dma. RSI, MACD, and the histograms are signaling positive news.
US Dollar Index
Uncharted Waters
The monthly chart below is a very clear indication of just where our dollar is regarding strength or retention of purchasing power - we are near to where hell could freeze over and miss us.
This is a monthly chart of the dollar going back to 1985 - 21 years of price action. These are monthly prices - not weekly or daily. They tell the tale of the long-term trend. The dollar is below both its 50 and 200 dma.
Notice the four (4) blue arrows that indicate where different bottoms occurred. Also, note that the four bottoms all occurred at the 80-price level. One just occurred a few weeks back.
We suspect that after any short term to intermediate term rally that the dollar index will break below 80. Most likely, some time later this year. When it does - all hell is going to break loose with it.
US Dollar Index Monthly
Another facet of Mr. Bernanke's conundrum is what is he going to do if the dollar does not just quietly fall below 80, but does it powerfully and with a loud thud that causes the whole world to sit up and take notice.
Such action would most likely precipitate subsequent reactions in various carry trades and in other assets tied strongly to the dollar's value. Remember - that level has NOT been breached in 20 years. We are entering unchartered waters.
A Dire Warning
The chart clearly shows just how debased and devalued our national currency is in relation to the exchange rates of other foreign currencies. In regards to a comparison with itself - the dollar has lost 95% of its purchasing power since 1913, the year the Fed took control.
This is a national disgrace of the highest order and must be addressed and corrected by our duly elected representatives. If those in Congress cannot or will not correct this blight - then vote them out of office for someone who will. Our monetary system should not be the laughing stock of the world. The writing is on the wall - we need to hear its message - to heed its warning, now.
Paper fiat debt-money is in its death-throes - its time is past. Now is the time for Honest Money of gold and silver coin: the self-same hard currency system mandated by our Constitution. It is time for all good men and women to stand up and be counted - declare you unalienable rights BEFORE it is too late.
Commodities
Commodities are one of our three paradigm themes for investing: precious metals, energy, and commodities. All three have been the best performing sectors of the market, however, presently all three are undergoing substantial corrections. Such price action is all very normal in bull markets, and actually builds an underlying an internal strength that can sustain larger moves up.
The CRB Index has broken well below its 50 dma and appears on its way to visit its 200 dma. Nether RSI, MASD, nor the configuration of its histograms register any oversold reading, so in this vein it has "room to fall" further.
CRB Commodities Index Daily
CRB Commodities Index Weekly
The above weekly chart of commodities shows a somewhat different picture from the previous daily chart. The price action going back well over a year's time shows it all keeping within its price channel. Back in March, the CRB hit the top of its upper channel trend line and has since headed down towards its bottom trend line at 330.
The width of the channel from the upper trend line at 370, down to the bottom trend line at 330, is 40 points. Presently the CRB is sitting at the 340 level. This represents a 30-point or 75% correct to date.
This is a significant correction and is an intermediate term trend - not a short-term trend. We are of the opinion that the 330 bottom trend line will hold and that when it does the next leg up in the bullish trend will unfold.
The above chart is a textbook picture of a bullish trend. Prices are running from the bottom left hand corner of the chart up to the top right hand corner of the chart - all in a series of higher highs and higher lows. A most bullish signature.
WTIC Oil Continuous Daily
Energy
Energy is another one of our paradigm themes for investing. The main assets in the energy sector we favor at this time are oil and natural gas. The oil sands of Canada are included. As the daily chart above shows, oil has been undergoing a correction along with all other commodities.
So far, oil has "bucked" the trend to break down significantly. As the chart shows the $70 price level is important. Both its 50 dma and its most recent lows are clustered around that level.
If broken significantly on a two day closing basis (and especially on a weekly basis) this would strongly suggest that oil is also entering an intermediate term correct and will head down towards its 200 dma. The momentum indicators are just beginning to register negative.
WTIC Oil Continuous Weekly
The above weekly chart of oil shows a much more bullish scenario - very similar to the weekly chart of commodities. The price action moves from the bottom left hand corner of the chart and rises upwards to the top right hand corner of the chart: a very bullish signature pattern.
Oil is presently a good distance above its 50 dma and well above its 200 dma. Caution is warranted, however, as some of the indicators are weakening and appear headed down.
Natural gas was hit with lower prices much earlier (months earlier) than all the other of the paradigm investment themes. As such, we would consider natural gas to be the best risk to reward asset play presently available.
Gold Continuous Daily Contract
Gold
Gold has had a near parabolic run up recently. In one weeks time it went from $600 to $722 per ounce. That is an increase of 20% in five (5) trading days. Likewise, gold has risen over 70% percent in less than a year, and has only given back approximately 14%.
Many gold bugs have started get nervous because of gold and silver's recent correction. The main reason in my opinion that they have been getting nervous is that they listened to trend FOLLOWING newsletter writers that were cheerleading the recent rise to new highs as the train was leaving the station, and if you were not on board you would miss the ride.
In a bull market, one sells into strength and buys on weakness. Anyone can follow prices and react ipso facto, but that is not how big money is made. It is better to be a leader than a follower of the herd.
Now that a correction of very reasonable proportions is occurring right when it should be occurring, many gold bugs are shaking like a leaf because the guru market letter writers never told them this was most likely to occur. Instead, they were jumping up and down raving and ranting about the record highs being made. They were even pontificating about future prices as the dollar signs were rolling in their eyeballs like a built in cash register.
So the $64 dollar question is: when is the correction in the precious metals going to stop? Answer: I dunno - wish I did. Nevertheless, there are some very good probabilities we can make ourselves aware of.
Back in October of last year 2005, I wrote an article titled Gold: Stage One or Two?. In the article, I mentioned how important the $500 level was to be broken through to the upside - which it was. Everyone was heralding in stage two of the gold bull.
As any good contrarian worth his weight in gold would have said - I countered with: "for me it is more important that the $500 level hold as support for the next intermediate term correction".
Of course, everyone shook their head and wanted to know what I was smoking. Poor boy he just does not get it. To be honest - that is the way I like it. If most agreed with me, I would get nervous.
Signposts On The Way
As the above chart clearly shows, there is significant support in the $525-$575 zone. I suspect that the lower boundaries of this zone will be tested. Below this level the next significant level of resistance is between $500-$525.
On Friday, gold broke through its 15-week moving average which was at $610.00. Gold closed out the week at $601.60.
Now that the 15-week moving average has been breached, the odds have increased that this is an intermediate term correction and that the 200 dma will most likely be visited. The 200 dma is at $540.47.
The very important 65-week moving average is at $500 - who would have thought - that we would be considering this price as resistance while it was being breached, or that we would conjecture that it suddenly represented support just after $722 had been touched?
This is why it PAYS to be a contrarian.
Below is the monthly chart of gold going back to 1980. It has some fascinating tales to tell. Let us listen and see what we can here.
The two parallel lines indicate the significance of the $722 level as well as the $500 level. Only four times has the $500 level been touched since the early 1980's. So this level is without doubt of grave significance.
HOWEVER, even if it were breached we would not unquestionably say that the gold bull was over. As we discussed early - higher lows are the most important component of a bullish signature.
THE LAST INTERMEDIATE TERM LOW WAS JUNE 2005 AT A PRICE OF $415.00
We are not saying that this level is a reasonable target level - but it is what it is - which is the last intermediate term low of the gold bull. Mark it accordingly. This is our line in the sand.
The recent rise to $722 was very quick and intense, and "overshot" all of the higher most probable levels of resistance for the move. Accordingly, we would not be surprised if the correction unfolds in the same manner.
We also are of the opinion that time may be a larger factor than the actual price level. There is a fair amount of overhead resistance to now be worked off. It is not going to happen overnight.
Gold Continuous Monthly
Silver
I can remember not long ago must of the guru's saying that silver had been demonetized, that silver would not perform the way that gold would.
Well guess what? Silver has outperformed gold to date. Silver has gained 120% since last September 2005 and has so far given back a little more than 20%. Therefore, silver is still up 100%.
Gold in the same period increased approximately 72% and has since given back approximately 15% - for a spectacular rise of 57%. Clearly, however, silver is the winner (at least so far). So much for the gurus.
Silver Continuous Contract Daily
Silver's 15-week moving average is at $11.80. Presently silver is at $11.12, which is below its 15-week average.
The 50 dma is at $12.87 and the 200 dma is at $9.62. Now that the 15-week moving average has been breached, it is highly probable that silver will head down to its 200 dma at $9.62.
It could even drop further to $8.88. Our line in the sand for the bull is $6.83 the last intermediate term low in May of 2005. Crazy? - undoubtedly, as is the fox. and loon.
HUI Gold Bug Index
We have saved our favorite for last - the gold and silver stocks. For the past several weeks, I have been chastised for my sacrilegious disrespect regarding buying or holding gold and silver stocks. FWIW - one does not marry their investment - one buys and sells them. Period.
For me this is a good thing, as it tells me I am thinking differently from the herd, which for me comes before any other type of analysis or system. Well over half the game of investing is being contrarian in my opinion.
HUI Gold Bugs Index Daily
Presently, the HUI is at 299.71, and it is below its 50 dma, which is at 349.44. The 200 dma is farther down at 287.38. Just last Friday the HUI hit and bounced off its 200 dma.
It appears that more downside is possible, however, we would not at all be surprised to see a bounce up rally for a few days early this week to set things up for options expiration.
As the monthly chart below shows, there is significant support at 225-255. If that level is broken then we could go as low as 175-225, but this would entail a MAJOR correction not only in the gold stocks, but a MAJOR correction in the overall stock market as well.
HUI Gold Bugs Index Monthly
Conclusion
At this time, we like cash and physical gold. We like physical gold over the stocks and consider it a much safer and less volatile investment.
I myself have taken five new positions in the gold stocks on last Thursday and Friday. As of now, I am just playing the odds of a short and quick rally. If it develops, I will most likely sell into it with a quick flip.
I do not foresee a large and long lasting rally occurring just yet. It would be too easy. I do not believe in easy money. I believe you have to earn it - the old fashion way - one lesson at a time - repeatedly, until is sinks in.
The overall stock market(s) looks toppy and weak, and acts just as bad as they look. Once again, a quick short-term bounce appears likely. I would use any such strength to sell into.
It appears that the overall stock market is realigning itself with the long-term bearish trend; at the same time that the precious metals (especially the socks) are entering an intermediate term correction. If this plays out accordingly - there could be a lot of damage done before it is over.
At times like this - the return OF your money is more important than the return ON your money. At least it is for me. Below are several good news articles. Enjoy. And that is a wrap.
Market Summary Outlook
| Market | Short-Term (0-3 month) | Intermediate-Term (3-12 month) | Long-Term (1-5 Year) |
| Gold | Neutral | Neutral/Bullish | BULLISH |
| Silver | Neutral | Neutral | BULLISH |
| Natural Gas | Neutral | Bullish | Bullish |
| Oil - WTIC | Neutral | Neutral/Bullish | Bullish |
| Gold & Silver Stocks | Neutral/Bearish | Neutral/Bearish | BULLISH |
| Commodities CRB Index | Bearish | Bearish | Bullish |
| Stock Market - S & P 500 | Neutral | Bearish | BEARISH |
| Stock Market - NASDAQ | Neutral | Bearish | BEARISH |
| US 30 Day T - Bill | Neutral | Bearish | Bearish |
| US 5 Year T - Note | Neutral | Bearish | Bearish |
| US 30 Year T - Bond | Neutral | Bearish | BEARISH |
| US Dollar Index | Neutral/Bullish | Bullish | BEARISH |
Come visit our new website: Honest Money Gold & Silver Report
And read the Open Letter to Congress


