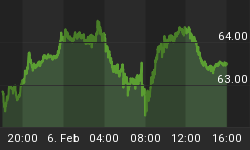
We have developed an amazing Buy and Sell indicator that identifies new trends soon after they occur, early enough to jump in and make a nice profit, or to prevent large losses by getting out to avoid being caught on the wrong side. This indicator is the Dow Industrials 30 day Stochastic and it is essentially a breadth momentum indicator. It identifies when breadth has changed and reached enough momentum to suggest that a multi-week or significant trend is starting, either up or down. Whenever the percent of DJIA stocks above their 30 day moving average (the Fast measure) rises decisively above a 5 day average of itself (the Slow measure), a new "buy" signal is generated.

Whenever the Fast drops decisively below the Slow (we define decisively as 10 points or more), a "sell" signal is generated. Different strategies can be devised with your investment advisor to target profits, set stop losses, etc... based upon your unique risk appetite and financial position. We update this indicator daily and report it to our subscribers. We also have similar indicators for the NASDAQ 100, Russell 2000, and the HUI Amex Gold Bugs Index. You can see from the chart that the correlation with price moves has been terrific. Most recently, a "buy" signal was generated on June 15th. The best success comes when taking a position immediately the day after a new signal is triggered.
Below you see the Elliott Wave count for the Dow Industrials. Our EW labeling is helped by these key trend-finder buy and sell signals and gives our subscribers an edge in analyzing where markets are headed. While there was a small Bearish Head & Shoulders pattern intraday Friday, June 23rd, because our signals are on a "buy," it suggests to us the high probability that a decline out of that Head and Shoulders top should be the remainder of the sub-micro degree wave {b} move down, with one more thrust up coming next week, perhaps topping after July 4th, due to positive seasonals.
After this rally completes, which is a Micro wave 2 top, a sharp decline should follow, wave 3 down.

"Beloved, do not be surprised at the fiery ordeal among you,
which comes upon you for your testing,
as though some strange thing were happening to you;
But if anyone suffers as a Christian, let him not feel ashamed,
but in that name let him glorify God."
1 Peter 4:12, 16
To receive a Free 30 day Trial Subscription, simply go to www.technicalindicatorindex.com and click on the "Free 30 Day Subscription" button at the upper right of the Home Page. Once subscribed, you will have access to our remarkable buy/sell signals on the blue chip Dow Industrials and S&P 500, NASDAQ 100, and HUI Amex Gold Bugs Index. A subscription also gains you access to our daily Market Analysis Newsletters, Traders Corner, Guest Articles, and our Archives. We now offer Multiple Payment Options at the Renew Today! button at www.technicalindicatorindex.com.
The Da Vinci Code: A Quest for Answers is available at www.davinciquest.org.


