


The charts and analyses that we share with you on this free website are quite different than what we give our paid subscribers.
On occasion, like this morning, I will share some of the information reserved for our subscribers.
One of the important things that investors should be aware of when investing, is the balance and ratio of Stocks that are in a down trend versus Stocks that are in an up trend.
When the % of Stocks that have Upward Strength far exceeds the % of Stocks that have Downward Weakness, then the market rallies up. When the % of Stocks with Upward Strength is growing, then a rally gets stronger. When the % of Stocks with Upward Strength starts to decline, then a rally starts to fizzle.
The opposite is true when the % of Stocks with Downward Weakness far exceeds the % of Stocks with Upward Strength.
To get the data for such information, we run an analysis on all the stocks on the various indexes. We then create a chart that shows both groups together.
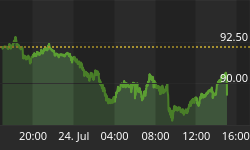
Today's chart is below ...
The % of Stocks with Upward Strength came in last night at a paltry 24.6%, and the % of Stocks with Downward Weakness came in at 75.4%. That means that there are 3.1 stocks with continued Downward Weakness for every 1 stock with Upward Strength.
It is not a surprise then, that the market is in a correction with only 1 stock that can go up for every 3 that can go down. These are the kind of conditions where investors should have gone to cash.
Looking at the chart, you can see that the market has essentially made no progress for the upside since June 11th.
*** We are not going to get a sustainable upside rally until these trends change.

Please Note: We do not issue Buy or Sell timing recommendations on these Free daily update pages. I hope you understand, that in fairness, our Buy/Sell recommendations and advanced market Models are only available to our paid subscribers on a password required basis. Membership information.


