


CNBC EUROPE
LET'S LOOK AT THE FTSE

Last week we looked at how the low was on significant support to hold the bull trend intact. Although I don't believe the trend is still up and am now looking for a lower high on the weekly charts, which should be below 5942. But that is now the big question that needs to be answered. Is this a base forming for another leg up or are we starting to see the process of establishing a secondary or lower high on the weekly chart as a prelude to a bear campaign. Last week I noted the "false break exhaustion" pattern at the low. The significance of the "false break" pattern for a low or high is if it is truly a false break exhaustion style low there should be drive to the high that started the move down in equal or less time. The index is now 7 days up versus a 7-day move down and still below the high that started the move down. So I can conclude that may not be a complete exhaustion of the move down. And another marginal new low is possible.
We also had a turning point this week for Thursday but could not qualify the significance of this "time" other than it would be resistance. The index did exhaust up into the date so a high of some sort is possible. The ideal low would now be another marginal new low below 5480. That would leave a three-thrust pattern for a low and set up a rally to produce a lower high or secondary high. The rally into a secondary high can take a few months. It is normal for the rally that produces the secondary high to take as long as 90-calendar days. And that would be out to September or October.
LET'S LOOK AT THE S&P 500 INDEX

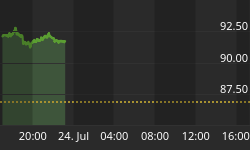
Has this past week set up a higher low or another lower high, that is the question?
So let's analyze this little pattern. Notice the downward arrows are highlighting two upward thrusts within this small pattern. You can also see volume has been drying up during this sideways march. If we could determine which direction the index was testing while volume drying up, we would know the index was going in the opposite direction to that testing. This is not very clear but with the spike up noted by the second downward arrow a "setup" is possible. IF the index cannot move decidedly above that day's high (the 21st) within the next two days odds favor the index will go down to test the last lows and likely show a marginal break. In other words, if the index is going up (which would indicate the testing was downside), it needs to do so immediately or a marginal new low is then likely. The first two days of this week can give us the direction of the next multi-day movement. Another day or two of weak rally will set up a move down. I believe the testing was to the upside due to the marginally higher daily lows, but it is not clear. The next day or two will make clear the direction out of this little pattern.
CNBC ASIA
You asked me to do a review of the YEN this week.
SO LET'S LOOK AT THE WEEKLY CHART FIRST

This chart represents a classic pattern of trend right out of my DVD instructional series. This is a classic "Blowoff trend" into the 2005 high. Blowoff trends are obvious because of the three or four ascending trend lines. It is also easy to see the start of the exhaustion leg or last leg up. The market exhausted, then broke and came down to the previous high, again something that occurs over 80% of the time. One of the keys to success in technical analysis is to know what is "normal" so you can avoid the abnormal. I didn't last over 40 years in this business by trading the abnormal. The bounce from the "previous high" produced a secondary or lower high that had three tests of the lower resistance level, again very typical of a lower high. The index then came back to the low that started the final exhaustion leg up and rallied.
Many of the world stock indexes have "blowoff trends" that appear completed and just came down to their previous highs as this market did and we're now trying to determine if they are producing secondary or lower high or basing for another leg up or a retest of their highs.
NOW LET'S TAKE A LOOK AT THE DAILY CHART

There is a very important technique I have explained on this show on numerous occasions. After the second test of the lower high the market came down 5 days. Remember my rule for this circumstance that once a market exceeds twice the time of the decline we can look for a failure of the rally. So there was an 18-day WEAK rally versus a 5 day decline setting up the fast move down. The fast move showed only first-degree counter trends of 1 to 3 days until it capitulated into low (again all very normal) and ran up to the lows of the secondary top or "obvious" resistance last week. The index only moved down 2 days and jumped into that zone of distribution still indicating strong momentum. The "normal" pattern of movement is to run into some congestion but to still get marginally above the last series of highs and then correct with a multi-week move down. It is that move down that will determine if there is a top in place (the pattern would be a lower double top) or if that move down can be qualified as a counter trend then a new leg up to new highs will appear. So now it appears as though the yen will test those highs at 119-level and then show a multi-week correct-that would be "normal."
LET'S LOOK AT THE ALL ORDS AUSTRALIAN

My forecast has called for this index to move down to the 4600 to 4625 level. If my forecast is correct and this is not now a significant low, then it needs to start down today. Considering the last low was at the price of a previous important low does offer a probability of starting a sideways pattern. But I still believe there is a possibility of a high this week and an attempt at the lows. The critical support level is the higher low near the 4800 level as that was ½ of one range, 1/3 of another and 3/8 of a third range. When that level was broken I thought it was a serious indication for the index but then it came back and successfully tested it with the higher low. Holding that level holds the bull trend intact. In order for the index to set up a lower high or secondary high it needs to come from a rally below that level and not that little "break and recover" that just occurred. Secondary highs take months to form so the start of that pattern tends to come from lower levels within a trend.


