


I dislike redundancy like many of you, but sometimes there are key market factors that are important enough to revisit and stay on top of. In this case, it is our VIX (Volatility Index) chart and how it is relating to the market.
Wednesday, we pointed out that there were still some market hurdles to be overcome ... in particular was the VIX (Volatility Index) which moves in the opposite direction of the market.
We showed that it had a major support/resistance level where it was stuck, and that there have been 6 occurrences where the VIX faced this line as resistance or support, and only once did it have a break through. We said that this hurdle is important for the market to break through in order to sustain last Friday and Monday's up move.
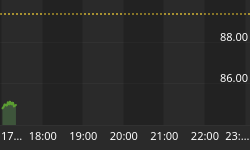
Friday's update: If you look at the red VIX trend line on the chart below, you can see that when it rose above its resistance line at label 3, the S&P went into correction. As of yesterday, the VIX remained above that line which means that the danger isn't officially over yet.
Until it breaks below the red horizontal line, investors will be subject to high risk, and whipsawing conditions.
The VIX does NOT replace other important market factors and signals from our models, but it something that is important for you to pay attention to right now. (If you are not a "paid subscriber" consider signing up to see the important market information, conditions, and buy/sell signals that you are missing at subscriber info.)

Please Note: We do not issue Buy or Sell timing recommendations on these Free daily update pages. I hope you understand, that in fairness, our Buy/Sell recommendations and advanced market Models are only available to our paid subscribers on a password required basis. Membership information


