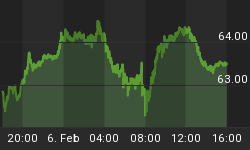
A look at the next chart shows the U.S. Dollar has started its descent into wave 5 of iii down, breaking decisively below the lower boundary of the wave 4 Rising Bearish Wedge. It should nestle around the 82 area +/-, then bounce in wave iv. All this is the start of a protracted move into the 60's, one that will no doubt be stair-step rather than freefall as Central Banks around the world work in orderly fashion to devalue the Dollar.


There was just simply too much M-3 created over the past several years. China, Russia, and several Oil exporting nations, the most publicized being Iran, are not happy about the Dollar as the world's reserve currency. They will be working against the Dollar. Bernanke cannot afford to support the Dollar given the tenuous Housing market and all those adjustable rate mortgages that Greenbackspan encouraged the flock to use, now a noose around the consumer's neck. This is all very good for precious metals of course.
Gold finished the Micro degree wave 1 up within an extending Minuette v of 5 of 3 up on May 12th at $730.40. The correction since is a Submicro degree zigzag {a}-down, {b}-up, {c}-down, with all waves looking complete. If so, Gold is rallying into its Micro 3 up of v. An alternate labeling is we just completed minor wave a down, and b up is close to topping. Next would be a final wave c down to wave intermediate 2 down. Unless Gold drops below $450, the top wave count labeling holds up. Where it breaks down is if the correction underway drops below the Minor degree wave 3 top from December 2004. In that case, the labeling would change to consider the May 12th top as the top of Intermediate degree wave 1 that started back in August of 1999, and the correction underway as Intermediate 2 down, a large degree correction. We do not see that happening in this monetary inflating environment.


Silver finished its Minor degree wave 1 up, and all three legs of 2 down, wave "a" down, b up, and "c" down are complete. Silver's wave 2 correction was a little more than .618 of 1 up. The move up from June 14th's 9.47 should be the start of wave 3 up. An alternate labeling considers June 14th's bottom a Micro degree wave 3 bottom, the rally since as micro wave 4, with wave 5 down to a wave c of 2 bottom next. In that case, a possible target for a bottom would be a Fibonacci .786 retrace of 1 up, taking Silver back down to $8.45. The problem with this alternate count is waves 2 and 4 are out of proportion with each other, which is allowed, but unusual. As a second alternate (not shown), it is possible to consider that all waves since last July are a degree higher than labeled, suggesting primary degree wave (1) up has completed, and a powerful correction, primary wave (2) is underway. We find this scenario implausible as there is just too much monetary inflation going on right now. We are comfortable with our top labeling as it is consistent with wave counts in other inflation assets such as Gold, Oil, and the HUI.
On the next page, we see Oil (West Texas Intermediate Crude) has completed its Minor degree wave 2 down correction, with 3 up underway. Wave 2 was a 3-3-3-3-3 Symmetrical Triangle. Normally triangles are wave fours or b's. Symmetrical Triangles mean the trend that occurred before the triangle will be the trend that occurs after it completes -- in this case up. We got a break up above the upper boundary of the triangle Friday, June 30th, an indication 3 up is underway. Get ready for $4.00 a gallon gasoline.


"For I am God, and there is no other;
I am God, and there is no one like Me,
Declaring the end from the beginning,
And from ancient times things which have not been done,
Saying, "My purpose will be established,
And I will accomplish all My good pleasure."
Isaiah 46:9,10
If you would like to see more of this analysis, to receive a Free 30 day Trial Subscription, simply go to www.technicalindicatorindex.com and click on the "Free 30 Day Subscription" button at the upper right of the Home Page. Once subscribed, you will have access to our remarkable buy/sell signals on the blue chip Dow Industrials and S&P 500, NASDAQ 100, and HUI Amex Gold Bugs Index. A subscription also gains you access to our daily Market Analysis Newsletters, Traders Corner, Guest Articles, and our Archives. We now offer Multiple Payment Options at the Renew Today! button at www.technicalindicatorindex.com, with subscriptions as short as one month, or as long as you'd like.


