


 In my May 26th update we showed evidence that the market structure for the OEX was pointing to a kiss back of its ending diagonal's trend line before leaving that area in a big way, which is exactly what it did! The OEX rallied all the way back to its lower diagonal trend line on June 2nd before selling off again. From there it dropped to a trend line bounce area that we were waiting to reverse our short trade at. We then looked for it to retrace back up to its Fib 61.8% of the entire drop from May, which it did, turning on a dime to continue selling off.
The high on July 6th was exactly within our announced Gann turn date of July 3rd to 7th. Most cycle analysts were looking for a high into the end of July, but our members were confident about our early date since we had just called the May top to the day!
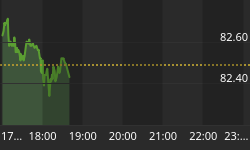
The chart below shows the brutal selling of the last 3 daily bars. We are getting a bit oversold here and expect a bounce soon, possibly after putting in another low next week. That bounce is truly going to tell us a lot about where some of these markets are going.

I have been stressing for a while, what the S&P's does with 1242 will tell me if the bigger picture has changed. At this point the S&P's have been vibrating around this important long term Fibonacci area as they are testing it. Once it makes this area resistance, we expect it to be on its way to test the Oct 2005 lows. At the moment we expect to bounce from that area, only to return there and break through it as we try to bottom into the 4 year cycle.
Our members have been well aware of this magnet at 1242 for quit some time. It also should have been of no surprise that the S&P's found support Friday morning exactly where this chart was saying it should have.

The markets now request constant analysis of their chart patterns and we continue to do that everyday. We cover a variety of markets such as the U.S and European Financial markets, Currencies, Metals, Energies, Stocks and Commodities. We use methods like Elliott wave, Gann, Delta, and many proprietary indicators.
Visit us at www.tradingthecharts.com.


