


CNBC EUROPE & ASIA
LET'S LOOK AT THE FTSE DAILY CHART

Last week I indicated the index was going to a new low for this trend down and the rallies would not exceed 4 days until a new low was hit. There is now a two-day rally that has shown support at 50% of the range down. This is a very powerful support pattern yielding a higher double bottom. I don't see this index being in a powerful move up so this last low should not hold. If that low can hold for two more days than there is a powerful low in place. My forecast calls for the June low to be broken so the higher low should be broken within the next two days and the June low by the first week in August and that should set in a stronger low.
LET'S LOOK AT TWO FORECAST FOR THE S&P 500 INDEX. THE FIRST FORECAST IS FOR A TOP AND A BEAR RUN.

There is a strong probability this index is now moving into a sideways pattern that will go on for at least the next six months maybe longer. All intermediate term sideways patterns be they tops or bullish consolidations all have the same basic timing. If they are tops then the timing is approximately 240 to 270 calendar days (2/3 to ¾ the one year cycle) high to high followed by a strong trend down in 2007, which sets up 2008 as a big bull year. I have drawn the last high to the top as a lower high but the pattern of the sideways move could show a marginal new high as the last high before the downtrend. The index could also show one more marginal new low but that should not be much lower.
THE NEXT CHART IS THE PATTERN AND TIMING OF A BULLISH CONSOLIDATION

If this sideways pattern develops into a bullish consolidation the time will be 180 days or 240 days low to low followed by a resumption of the bull trend. On that historic basis there is likely at least 6 months before the up trend resumes. Since I doubt the June 14th low is "THE" low to this move down. In fact that is unlikely, in order to create a bullish consolidation there needs to be a new low as this trading is still too high up into the last range to accomplish this pattern. So there would still be another lower low and from that low we would start the 180 or 240 calendar day count to show us the last low before the trend resumes. If a new low was hit the first week in August that would indicate resuming the up trend February or April. That low could be around 1165 but not below 1135. Remember we are looking for 2008 to be a big bull year and 2007 to set up that probability.
These are the two highest probabilities for this index the next 12 months. I give these two scenarios a 90% probability.
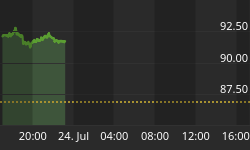
LET'S LOOK AT THE ALL ORDS AUSTRALIAN INDEX
This chart is the last range divided into 1/8 and 1/3. You can see the 50% mark that support the last higher low. This will be tested and is also significant support from three other ranges. Last week I indicated none of the stock indexes will rally past four days until a significant low is in place. I assume this important level of support will be broken and a new low will occur within the next two weeks.


