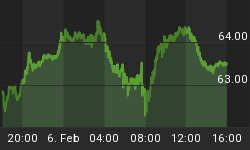
The Australia SPASX 200 Index declined 41.40 points, or 0.83 percent on Friday, August 4th, 2006. Volume was at its 10 day average with downside volume at 72 percent, declining issues at 73 percent, and downside points at 91 percent. Demand Power fell 5 points to 378, while Supply Pressure rose 5 points to 410. This tells us Friday's decline was strong as buyers retreated at the same time that sellers showed up. Sometimes declines occur when buying dries up without a corresponding increase in selling. Those types of declines are often found inside downside corrections of an uptrend. That's not the case here, which is Bearish.

Both key trend-finder indicators remain on "buy" signals Friday. The ASX 200 Purchasing Power Indicator, which measures supply and demand, fell 2 points to 70.67. It would have to drop more than 6 points from its recent high, below 68.90, to generate a new "sell" signal, so it remains on its "buy" from July 25th. The ASX 200 30 day Stochastic Fast comes in at 37.00, below the Slow at 41.78, but not decisively below. The Fast must drop more than 10 points below the Slow to trigger a new "sell." This breadth momentum measure thus remains on its "buy" from July 27th. The best time to take a new position in the market, we have found, is the day after both key indicators generate new signals that are in agreement with one another. We have found these signals often identify at least a 2 percent move, which can generate enormous profits for options traders, or can help conservative traders time their entries and exits. Our indicators are entry points. Exiting comes from strategies that fit an investor's unique financial position and risk appetite. For example, some folks target a 2 percent move, then get out. Others, with more risk appetite, target higher percentage moves, but raise stop losses. Some aggressive investors take short positions when "sell" signals are generated, while conservative investors simply raise cash and wait for new "buy" signals to reenter long positions. The 10 day average Advance/Decline Line Indicator fell to minus -13.3, and remains on its "sell" signal from July 18th, 2006.
Our Elliott Wave analysis shows that the Australia SPASX 200 Index fell to a wave 1, 4,758.30 bottom on Wednesday, June 14th, and then rallied in an {a}-up, {b}-down, {c}-up of wave 2 up with 2 up completing July 7th at 5,146.60. The $SPASX200 fell 648 points, or 12.0 percent since it hit an all-time high on Wednesday, May 10th at 5,406.70 intraday, and on a closing basis at 5,364.50 on May 11th, our last Hindenburg Omen observation. The top is in for wave c of e, the final component of a 3-3-3- 3-3, a-up, b-down, c-up, d-down, e-up five-wave Ending Diagonal Triangle of intermediate degree, wave 5 up of its final primary degree wave (5), the completion of a huge Bull market. That final wave e up exceeded the upper boundary of the Intermediate-term Rising Bearish Wedge, spiking as often happens during the last legs of a rally with this pattern.
The decline since broke decisively below the bottom boundary of the multi-year rising Bearish Wedge, confirming the major top is in. Micro degree wave 1 down has completed, and wave 2 up has also. Micro 3 down has begun with a decisive break below 5,050, wave {1} down finished and {2} up nearly so, closing at 5,027.10 on July 31st. Alternately, the decline since May 11th can be interpreted as a three-wave corrective decline, meaning what we have labeled as 1's bottom is really d's bottom. If that is the case, then prices are traveling in a parallel trend-channel for 5 up, with the final leg up occurring now. We do not believe the alternate labeling is occurring.
This is the inaugural edition of McHugh's Australia Financial Market Analysis, featuring market coverage of the SP ASX 200. This service will provide daily coverage, with daily briefings posted at www.techncialindicatorindex.com on a timely basis, with an expanded weekend issue posted Saturdays. Our scope features daily generation of key trend-finder indicators based upon breadth momentum and supply and demand, our 10 day average advance/decline line indicator, Elliott Wave analysis, a measure of each day's Demand Power and Supply Pressure with analysis, and statistical recaps with commentary. Our aim is to provide you with comprehensive analysis of where this major equity index is headed, when, and by how much, presented in an executive format. Our key trend-finder indicators identify upcoming moves that have multi-week, significant trend potential.


For a Free 30 day Trial Subscription, go to www.technicalindicatorindex.com and click on the button at the upper right of the Home Page.
Bottom Line: The next major wave down, {3} down, could come at any time. Caution is warranted.
Jesus said to them, "I am the bread of life; he who comes to Me
shall not hunger, and he who believes in Me shall never thirst.
I have come down from heaven.
For this is the will of My Father, that everyone who beholds the Son
and believes in Him, may have eternal life;
and I Myself will raise him up on the last day."
John 6:35, 38, 40


