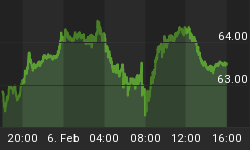
Since Trannies topped on May 10th at 5,013.66, the day before we got our last Hindenburg Omen, they have crashed 878.94 points, or 17.5 percent (we define a crash as a 15 percent plunge over several weeks). They quickly plunged 479 points, or 9.6 percent, over two weeks in May to reach their Micro degree wave 1 bottom at 4,534.63 on May 24th. Trannies' wave {a}-up was a three-wave affair that topped at about the .50 (was .53) retrace of Micro 1-down, up 254 points to 4,789 on June 2nd. Wave {b}-down took Trannies to 4,410 on June 8th. Wave {c}-up of 2 completed a Rising Bearish Wedge termination top pattern on July 3rd, at 4,975.


The NASDAQ 100 has been crashing since May 8th, but has anybody noticed? Since the NDX topped at 1,721 on May 8th, three days before our last Hindenburg Omen, the NASDAQ 100 has crashed 15.94 percent. It is down nearly 18 percent since its January 11th top, and is down 12 percent for the year. Worse, this crash is not over.
The Elliott Wave labeling has wave i down of Minor degree 3 down finished, as is wave ii up, in what was a double zigzag/flat wave for corrective ii up. Now that ii up has finished, a huge decline, wave iii down is in its infancy. Waves ii up, and the start of iii down have formed a Rounded Top pattern, which is Bearish. This is the start of primary degree wave (C) down, the third leg of an (A) down, (B) up, and (C) down that began in 2000. (C) has the potential to take the NASDAQ 100 down to the 700 area. We'll see if Ben and All The Fed's Men can support these markets.
"And He was saying to them all, "If anyone wishes to
come after Me, let him deny himself,
and take up his cross daily, and follow Me,
For whoever wishes to save his life shall lose it,
but whoever loses his life for My sake, he is the one who will save it.
For what is a man profited if he gains the whole world,
and loses or forfeits himself?"
Luke 9:23:25
For a Free 30 day Trial Subscription, go to www.technicalindicatorindex.com and click on the button at the upper right of the Home Page.


