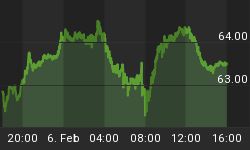
After a period of gold outperforming silver, the tables have turned and in recent weeks silver has been outperforming gold. Both weakened late last week and look set to react, but whereas gold looks set to react to a support level, silver looks set to react to the lower boundary of an uptrend channel drawn from the June low.

On the 6-month chart we can see how the recent rally took the price further into overhead resistance in the area of the April - May intermediate top, before it started to roll over late last week. Now it looks set to retreat back to support at the lower channel boundary shown on the chart, which is currently at about $11.25. As with gold, there is a chance that a lengthier period of consolidation will occur, which in gold's case would result in it breaking down from its prospective triangle that would morph into a Rectangular pattern, and in silver's case would mean a failure of the trendline and a further drop probably to support in the $10.50 area, close to the 200-day moving average.

The longer-term 5-year chart presents a similar picture to gold - a market that ran up quickly, and is now taking a breather.


