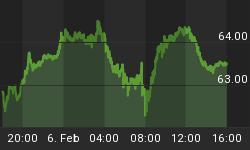
After the Federal Reserve announcement not to raise interest rates, gold fell form $620 to 613.
Support levels for gold are found at $595 established on 4-6-2006; $570 on 3-29-2006; and $540 on 2-13- 2006.
The 60 week gold chart from www.stocktiming.com for the period ending 8-18-2006 shows gold at $613.
The 5 x 3 gold chart from www.the-privateer.com for the period 1982 to 8-18-2006 shows gold $615.

The 1 x 3 gold chart from www.the-privateer.com for the period 3-10-2006 to 8-18-2006 shows gold at $613.


The 12 month US Dollar Chart from www.quasimodos.com from 8-18-2005 to 8-18-2006 shows the dollar at $85.09
A move of the dollar above the 50 day moving average of $85.74 will be bearish for gold. Conversely a move below $84.00 will be bullish for gold.
The inverse dollar gold relationship is documented in these articles The Sinking Dollar and Rising Precious Metals by Robert McHugh
A Trendless Dollar: The US Dollar Index Has Been Stuck On Either Side Of 86
The Elliot wave gold chart (from The ELLIOTT WAVE Lives On website) shows a 3 up at 730 and a 4 down at 542; the website is stock bullish and still targeting SPX 1383 when this chart was prepared. However, this will never-ever happen; the recent 8-18-2006 rise to 1302 may spur some more activity to 1304; but that value is likely to be the future high. The S&P will never again reach its high May 5th, 2005 high of 1325, in as much as The Ides Of May 2006 Was The Pivot Point Of Global Financial Meltdown, Three noteworthy things about this chart: First, the power of the 3 wave; the 3 wave is the most powerful of all waves; it took gold from 575 to 730. Second, correction wave 4 will take gold to the range of $570 to $540. Third, $818 gold is a reasonable target for wave 5; with $818 coming from the work of Mr. Alf Field (referenced later in this article) and $818 being the end of a line drawn from $541 through $730.


The year to date gold chart from Gary Tanashian as of 8-18-2006 shows gold at $614. From this chart a fall to $570 seems entirely reasonable.
Conclusion
Gold is falling having completed a 3 wave up, support levels for wave 4 down are at $595, 570 and $540. Wave 5 up will take gold to over $800.
The most dramatic part of the any Elliot Wave is the 3 wave, that is, either a 3 up or a 3 down. Having completed most of the upward thrust via a 3 wave, Alf Field has suggested a target for the peak of wave V at $818. He subsequently has revised his Elliot wave count and now relates that gold may easily go much, much higher;which is something that I totally agree with but his higher figures are probably at least one to two years out.
It should be noted that the price of gold is also influenced by the price of oil; yet, the primary mover of the price of gold is the price of the U.S. Dollar
Once the dollar falls below $84.00, the price of gold will soar again as investors seek to preserve their wealth from the ravages of fiat investment collapse and as the price of oil soars due to the Bush administration's Global War On Terrorism And Islamo Fascism
It will take a major event to drive the dollar below $84: one such event being the installation of the North American Union as called for by the Leaders Joint Statement at the Cancun Summit. In this summit, the three presidents of the North American Continent produced six action points to insure that the North American Union be in place before the end of the year. Primary amongst these is the "Provision for North American Emergency Management;" the leaders are developing a common disaster response, for events whether natural or man-made; and the leaders are conducting coordinated training and exercises, with the participation of all levels of government in all countries. Thus a continental wide emergency is almost a certainty before the end of the year. The response will be to use NORTHCOM to manage United Nation peacekeepers for security and order. Such an emergency will drive the dollar below $84 and send gold quickly over $800.
Lets return to the 60 week gold chart from www.stocktiming.com Using the extension line drawn downward a price of $570 for gold is entirely reasonable. The wise investor will take time now to preserve his wealth by buying gold below $600 - at $570.

One means of buying and storing gold is at BullionVault.com and another is buying gold coins. Having a small amount of gold coins immediately accessible is a wise thing; with the safest place for these buried on one's property under concrete where one can dig them up in a time of need.


