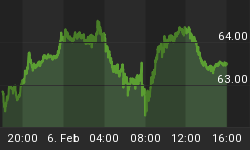
As we have been expecting the gold indices, the HUI and XAU have now broken out as can be seen on the charts below. The HUI is now clearly above the 350 level and the XAU as of today has cleared the 150 level. We are showing you two charts of each indices at approximately 11:15am (CST); the first chart of each is a 3 month chart and the second is a 6 month chart.
Spot Gold and Silver as we write this article is at 639.50 (up 15) and 13.01 (up .09), respectively.
Charts:


In our most recent article, "Is 'The Shopping Season' Over?", we anticipated this breakout and encouraged investors to get on board soon. If you still have not finished your 'shopping' you best get busy so as not to miss this wave up.
Admittedly, not all analysts are in agreement and some still consider this a time for caution. (I love it, as I think this is bullish.) Some analysts/newsletter writers believe the metals markets still need to retest the lows because the sentiment, in their opinion, is not/was not negative enough to begin a new rally and wave up.
We are of the view that 'this bull market' will attempt to trick the most savvy of all investors, analysts and newsletters writers and that it will not be possible for any of us to be correct all the time. Could we be wrong this time? Of course! However, we prefer to be aggressive investors as we have sensed this rally coming (hell, it's here) and wanted to be in early rather than late. Nothing will go straight up so you will have additional entry points with the inevitable pullbacks in our path.
Investors, today have many different investment vehicles into which to position themselves; ETF's, mutual funds, actual purchase of gold and/or silver bullion, mining shares and/or long-term warrants on mining shares.
Most important for you is to get onboard, be patience and enjoy the ride.


