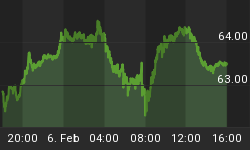
Today, we will stay with looking at the VIX (Volatility Index) versus the S&P 500.
By now, you can see the importance of the VIX's relationship to the market's movement and how important it is to draw good support and resistance lines on the VIX.
Note what happened when the VIX went above the first red (lower) resistance line. The market dropped.
Yesterday, the market dropped again as the VIX went Higher ... But ...
Yesterday, the VIX hit its second highest red resistance line and stopped immediately upon hitting it and then dropped back.
There is a good chance that it will now pause and move lower today. Since it moves opposite to the market, that would be positive for the market today as long as it continues to trend down.
Follow it on your own and look at a 5 minute $VIX chart along with the S&P. Note that any trend direction change on the VIX will produce the same and opposite change on the S&P.

Please Note: We do not issue Buy or Sell timing recommendations on these Free daily update pages. I hope you understand, that in fairness, our Buy/Sell recommendations and advanced market Models are only available to our paid subscribers on a password required basis. Membershipinformation


