


Q&A: This weekend we respond to readers questions.
Dear Speculators,
As promised, this weekend we'll publish responses to reader questions.
Q: How many trades do you anticipate per month?
A: We expect roughly 2 to 6, depending on market accuracy and the action of the system.
Q: Do I have to follow your emails all day long to follow your system?
A: No, we act in the morning, so as long as you can check your emails before the open, you can follow our system. Or you can participate with one of our auto trading brokerages.
Q: Will you update every afternoon in the Rydex Dynamic Trading?
A: No. We provide intra day updates - periodically when market conditions warrant. However, we act in the AM, so intra day updates will not contain trading advice.
Q: Do you have back tested results for your system?
A: No. I'm a big opponent of back testing. I've seen numerous back tested systems eventually fail, even after great runs, because there is always a subjective component that can't be programmed when the system is actually put into practice, or because the data elements that the system utilizes change and the programmer/trader is unaware of these underlying changes in a key data element to their system. Unlike any other trader, I enter my system data by hand into a spreadsheet and don't rely on data providers for accuracy. I check each piece of data and perform a modification to one piece of data that no one else does - based on my in depth knowledge of the intricacy of these data elements. By paying such close attention to the data, I can see when they go through changes and monitor how those changes impact the system. As we develop a track record, that track record will be posted to the site and will allow you to see how the system actually performs - not how it hypothetically performs.
Q: With the Rydex Dynamic System, do you recommend taking the AM pricing or trading at the close?
A: While we recommend the AM pricing, the system can be followed by trading at the close. There's an element of randomness in market timing where a system will either be rewarded or not by pricing between the am and the close. Most traders don't accept this very short term randomness and feel the need to act as soon as possible on any signal. This system is designed to get you in early. So the precise timing of entry - over time - should have a limited impact on the system performance.
Q: Your system was on a sell signal - why are you issuing another sell signal?
A: When I took over this service, it was on a sell signal and had short positions open. On Wednesday, those short positions were stopped out by our auto traders, effectively closing out the last position on the previous system and allowing us to open a new position under the new system. Since we have some readers on auto trading and some readers who were not and never updated traders for the activation of a stop - this inaugural signal was meant to get everyone in sync with the new system going forward. Accordingly, if you're following us, you should be short.
Q: Are you going to trade the SPY?
A: No, we'll no longer trade the SPY - the service will be renamed the QQQQ Alert. We trade one thing and we trade it very well. Diverting your focus only leads to watering down potential performance. Of course with increased reward comes increased risk. But that's the nature of trading the Dynamic Trading Service.
Q: What type of drawdowns do you expect?
A: We can not answer this question at this time as 1) the answer would be specific to the individual vehicle you trade - QQQQ, versus the Rydex Venture/Velocity, versus the QQQQ Options. Over time, as we produce trades, this drawdown will become evident and we'll report on it frequently. The good thing about short term trading is that drawdowns are usually limited in time as the system responds more quickly to short term moves.
Drawdowns are interesting phenomena in the newsletter business. For the most part, people tend to subscribe to a newsletter when a system is doing its best, which is normally right before a drawdown. The new subscriber goes through a drawdown and usually unsubscribes, which is usually right before the system goes through its next advance. I've been doing this long enough to see this cycle through several times. In fact, I can usually see market bottoms by the number and negative nature of emails I get from subscribers. And vice versa, I usually get a market top just after I write an article about how well the system has performed. It's just human nature.
Q: How is your system different from your stockbarometer system?
A: Time frame. The stockbarometer is a combination of short and intermediate term oscillators that try to position for each and every market swing but are tuned to deliver its best performance in intermediate term market moves. Dynamic Trading is a series of short term oscillators that are tuned to deliver the best returns when the market is going through short term oscillations. The DT may under perform in intermediate term trends. The DT is designed to be complimentary to the barometer system. But they are not the same and will obviously go through periods when they are not in sync. Both systems trade at the open.
Of course, if you have any additional questions, please feel free to email me at jay@stockbarometer.com. Be sure to reference Dynamic Trading, since the service you subscribe to will determine the perspective of my response.
Dynamic Trading Signals are based on a series of Oscillators tuned to the short and intermediate term movement of the market. Our goal is to be in the market at all times and switch from bearish to bullish positions in line with the markets movements.
DYNAMIC TRADING OSCILLATOR

Discussion: Here are the DT's primary two oscillators - and the main reason we went short on Friday. We'll now include a short term oscillator with every Weekly Wrap Up - to prepare you for the week ahead. This will take the place of Monday's Morning Call. And we'll return to our normal schedule on Tuesday mornings.
10/20/40 WEEK CYCLE
The following chart shows our 10/20/40 week cycles. The 40 week is also referred to as the 9-month cycle. Cycles are not short term tools for determining precise entry and exit points, they're primarily used for intermediate or longer term positioning and forecasting.

INVESTOR'S INTELLIGENCE BULL BEAR SPREAD
Each week, Investor's Intelligence polls a number of newsletter writers. The poll results in a number of bullish advisors and a number of bearish advisors. The difference between those two numbers produces the following chart. It's believed, that when a majority of newsletter writers (like us) are bullish, that the market is near a top, and vice versa. I'm also under the belief that the direction of this line is as critical as the number.

EQUITY INDEX OPTION VOLUME RATIO
The market is all about risk, and there are two primary classes of participants in the market, the individual investors and the institutions. Individuals primarily trade equity options and institutions primarily trade index options. So the relationship between the two gives us an idea of how much risk the individual is willing to take on. At tops, the individual tends to take on too much risk, making this indicator rise. At bottoms, the individual is usually washed out of the market, making this indicator fall.

QQQQ v. SPY RELATIVE STRENGTH
Risk tells us a lot about the market. This indicator looks at risk from another perspective. When market participants overall increase their willingness to take on risk, it's bullish for the market. That risk shift is shown on the above chart as a shift in relative strength from the Nasdaq to the NYSE. Note when we refer to Nasdaq, we're primarily looking at the QQQQ - since that's the focus of our service. And when we say NYSE, we look at the SPY.

MONEY FLOW
This indicator looks at the flow of money in and out of various investment vehicles. For the most part, when money flow reaches an extreme, in either buying or selling, the market is at a top or a bottom, respectively.

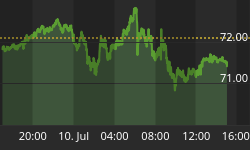
NDX CHART

In summary:
While the system issued a Sell Signal on Friday and we positioned short, the intermediate term indicators above suggest that we're not in for the dooms day scenario that others may have you believe is ahead of us. With the Fed meeting on Wednesday, it may take a few days for whatever the next market move to set up and get going. We also have a divergence in the market whereas the SPY has reversed below resistance and the NDX has broken the previous swing high on increased volume.
As for position entry, in each of our services, the action on the nasdaq was what we expected - a gap up and close lower, which has characteristically marked several previous tops in the NDX. This gave us good pricing (better than had we bought on the close the day before) and each position is showing a profit. But a day does not a trade make, and next week should be a tough road as the market digests a Fed meeting and volatility should increase as we move into a seasonally weak period.
Best regards and good trading!


