


Dear Speculators,
Our forecast for the stock market since the summer lows (near SPX 1220) has been for a light-volume rally up to test the spring high (near SPX 1326) and for failure of that rally and a tumble down into a September-October re-test of the summer lows. Since we issued that forecast we have also had in place a caveat; that if Crude Oil and Gold should drop precipitously in price, then the need for an aggressive Sep-Oct low could be obviated.
Well, just such precipitous declines in Crude Oil and Gold have occurred, and this leaves the question wide open as to whether the SPX will manage to break to new highs and hold them before it "should" do so, cyclically speaking, later this year.
Here is our updated 4-Yr Cycle chart, which tracks each 4-Yr Cycle on the SPX since 1962. The vertical axis is scaled as percentage gains off the 4-Yr Cycle Low. The horizontal axis is scaled as Trading Days since the Low. And the 4-Yr Cycle Low is defined as the lowest closing price between September 30 and November 19 of every 4th year (1962, 1966....1998, 2002...).

The current cycle is represented by the thick red line. And as you can see, it falls very clearly in the "middling" group of 4 previous cycles over the past 44 years; it is neither in the "very strong" group ('94-'98 and '82-'86) nor in the very weak group ('66-'70, '70-'74, '78-'82, '98-'02).
So, in looking for guidance in how the current cycle might behave, let's look more closely at the middling group.

The SPX has now completed Trading Day # 990 in its current 4-yr Cycle. The 4 previous cycles in the middling group have all topped out between Trading Day #992 and Trading Day # 996 before heading into significantly serious/tradable declines.
And if we scroll up to the first chart above we see that 8 of the previous 10 cycles (including the very strong and the very weak) have endured similar tradable retrenchments during the coming "home stretch" of the cycle.
Looking strictly at the yearly calendar, the SPX closing price on September 26 has been lower than the close 7 trading days earlier (in this case September 15) 65% of the time with an average performance over those 7 trading days of -0.65%. On the 35% of the occasions when the market has risen in this time frame the average gain has been +1.5%. On the 65% of occasions when the market has fallen in this time frame the average loss has been -1.85%.
Statistically the odds look to favor the bearish case in the short-term. But whether those probabilities will be trumped by plummeting energy prices remains to be seen.
This chart of XOIL (Light Sweet Crude Oil Index, candlesticks) plotted against the SPX (red line) has a number of interesting features worth exploring.

First of all, over the past 2 years, both XOIL and SPX have trended higher. The overall correlation for the 2 series over this time period is a very strong +0.75 (not shown, but take my word for it). You wouldn't think that the stock market would behave so well in an environment of soaring energy prices, but there it is.
One of the features that I want to draw attention to, though, is the Smoothed 20-day Correlation, which is shown as the pink line in the lower pane. This line represents the 10-day average of the 20-day correlation. This line tells us whether the stock market is moving with or against the price of Crude, and has recently hit its lowest level (-0.79) since May '04; the current reading is its second lowest since the bull market in oil began, quantifying just how extreme has been both the recent push higher on the SPX and the simultaneous move lower on XOIL.
And what does that mean in terms of prognosticating market direction? Generally an extremely negative reading on the pink line (such as the one we see now) suggests that either one or both of XOIL and SPX are pretty close to exhaustion in terms of their respective trends. That is, Crude is likely to see a snapback rally; meanwhile the SPX, which has been rallying since about August 9, supported by the disinflationary implications of falling energy prices, could endure some profit-taking as Crude snaps back.
This scenario would fit hand-in-glove with the seasonal/cyclical likelihood of SPX weakness in the weeks ahead.
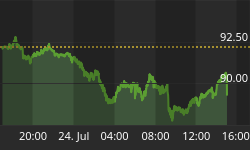
This next chart shows us GLD, the Exchange Traded Fund that tracks the price of Gold.

GLD has fallen -9.4% in the past 8 trading days and is quite oversold on a short-term basis. Given that oversold condition, we would look for a snapback rally this week, one that makes an effort to close at least one or 2 of the 3 gaps on the most recent 8-day decline.
The ETF has marginally broken the line of rising lows that constitutes the Neckline of an impressive Head & Shoulders (H&S) Top. If, after the expected snapback rally, GLD breaks the Neckline to the downside again, that brings into play a technical target of $40 for GLD. (The target is derived by projecting that the depth of the decline from the broken Neckline will be equal to the height of the Head above the Neckline.) Whether that $40 target would be met is questionable, but ultimately we would look for $44.50, near the top of the 12/04 - 9/05 trading range.
Of particular interest is the fact that both the Head (H) and the Right Shoulders (RS) of the H&S Top are "Island Tops." An Island Top is a group of candlesticks that has a gap on both its right side and its left side and represents a very powerful reversal, most especially if the gap on the right side of the formation remains unfilled. So, whether the impending snapback rally can carry the price back up above $60.28 should be telling. (If it can't, then watch for lower prices in a hurry.)
In addition to sharp moves in Oil and Gold we have recently seen a large change in the 10-Yr Treasury Yield (TNX), which has fallen from about 5.2% to about 4.8%.

This chart shows TNX plotted against the SPX in the top pane. In the bottom pane we revisit the Smoothed 20-Day Correlation (green on this chart). Over the past 6 weeks the correlation between the SPX and TNX has gone from being positive to the most negative it's been since May '04.
With TNX dropping the 10-Yr Note has been rallying. So, both stocks and bonds have been rising together. Money has been moving out of the commodities markets, into bonds, and into the stock market.
As you can see on this chart, very low negative readings on the green line often correlate to important turning points on TNX, especially after protracted trends. (Note: Very high positive correlations to the SPX also portend reversals on TNX, but we're not studying those at the moment.)
So, after looking at the charts we have significant reasons to believe that the downtrends in Oil, Gold, and the 10-Yr Treasury Yield, all of which have supported the SPX rally, are quite mature and probably ripe for tradable short-term reversals. And all this is happening as we enter the seasonally weak 2H September period in an extremely treacherous point in the 4-Yr Cycle.
In our view all of the above makes it prudent to be skeptical about the near-term bullish case on the stock market, at least for the moment.
With Health Care, Technology, and Consumer Discretionary stocks now showing positive Relative Strength, and with Industrials, Utilities, Consumer Staples, and especially Energy stocks, all former leaders, either underperforming or starting to underperform, we are seeing exactly the sort of rotation of buying interest that we had been expecting to precede the 4-Yr Cycle Low in the market. But it would be an unusually/extraordinarily "soft landing" indeed if this kind of rotation of leadership did not generate a noticeably cathartic/tradable/buyable decline between now and the latter part of October. Historical precedent suggests that such a decline is quite likely.
Best regards and good trading!


