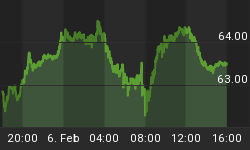
As mentioned recently, I have not been writing about gold personally and presenting articles about gold in the News & Analysis section of the website because I am a gold bug. I am doing so because this is an asset class and sector that has been presenting ongoing buying opportunities. As you know, I have been taking advantage of those opportunities on down days, buying the sector from uncertain, uncommitted or downright scared holders. In today's emotional and turbulent markets, it seems many frown upon an old fashioned concept like "buy low and sell high", but I plan to stick to that crazy notion.
First and foremost in our value analysis is the Dow-Gold Ratio chart (see 10/4/06 entry below). This is self-explanatory; stocks simply became over-sold in their secular bear trend vs. gold. That condition is being corrected. When we look past the hyperbole of the Dow headlines and talk of the end of the bull market in the barbarous relic (now that the Fed has inflation under control - wink wink) we simply see a re-setting of the ratio, nothing more and nothing less. It pays to use technical analysis to help moderate emotion when trying to make sense of market trends and cycles.
Without further delay, I would like to present some relevant charts of gold, silver and copper, which benefit from different economic climates: Gold- Economic contraction, inflation (inflation is not only possible, but probable in a contraction since inflation is the increase of money supply) and by extension, the outright questioning of paper money backed by nothing but debt. Silver- More levered toward global economic growth, inflation, sometimes thought of as money - with historical record to back it up. Copper- A base metal critical to the global economic growth story.


In these charts we see conflicting signs for the liquidity-driven growth economy and by extension, the stock market. Gold and silver appear set up in similar fashion although gold has resistance that corresponds with a symmetrical triangle breakout whereas silver's comes well below such a breakout. Both metals sport some nice short-term bullish divergence, but gold's picture overall looks more bullish. A look at copper shows an ongoing consolidation with a nice spike up yesterday, although no breakout. If FrankenMarket's advance is real, expect confirmation by copper, a global growth lynchpin. Finally we have the Gold-Copper Ratio. Here we see gold has broken down below the double bottom, which if it holds would imply that global growth is to continue beyond the near-term. However, note the bullish divergence in gold vs. copper. It is common for breakdowns in an index or ratio chart to be reversed within a few days (head fake), so this will need confirmation in terms of time.
Summary: To these eyes (and I try to remain impartial) the metals offer conflicting signals as to the direction of economic growth (or lack thereof). Taking into account the stock market's over-extended status (not to mention the bearish VIX & VXN), gold's proximity to a significant breakout and copper's trend line way down near 280, one might at least strongly consider the possibility of some bearish surprises ahead for markets and commodities dependant on economic growth. Yes, I did buy the US Oil Fund (USO) per the 10/13/06 Letter entry, but the energies have already been hit hard as though there is going to be an economic slowdown issue and that purchase may only be for a swing trade. Gold miners may be a different story if confirmation of the above charts' signals proves bullish for gold. That is my favored scenario. If copper and to a lesser extent silver dominate in the near term, then the opposite is likely to occur; continued economic expansion, where gold and its miners are likely to underperform. ETF's and stocks relevant to the above include GLD, SLV, CEF, GG, SSRI, USO and PD, which interestingly has failed to attain new highs with the stock market.


