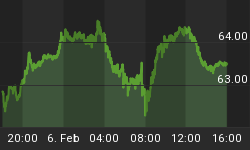
What is happening on the price trending for the "core holdings" owned by Institutional investors?
*** We reported on this last Friday, and today's updated chart is below.
Below is a 8 month chart showing our Institutional Index.
Three distinct patterns have occurred since April.
1. From April to late June, the Institutional index had a down trending Channel that was a wide channel.
2. From the end of June to late August, the Index had a rising wedge pattern. It broke the rising wedge to the downside.
3. In late August, it immediately rebounded up from the rising wedge drop and formed a very thin and narrow rising Channel with a high angle of ascent.
This tight channel has had the index's price bounce off of the channel's resistance 9 times since then, and it had successfully held the Channel's support line 4 times.
This is a hard angle of ascent to hold over a long period of time.
*** In the past week, the Institutional "core holdings" index continued up within its channel as seen in the chart below.

The VIX (Volatility Index) goes up, and the market goes down. The VIX goes down, and the market goes up ... that's basically how the VIX works.
Below is an hourly VIX (Volatility Index) chart of what has happened since September relative to the S&P 500. This is an update on the chart we posted yesterday ... link: Thursday's VIX
Note the slope of the S&P's support line and the slope of the VIX's resistance level. This is exactly how they should be behaving with each other.
Note how perfectly the resistance levels have been hit on the VIX. There were 4 exact hits on the resistance line. Each time the VIX hit its resistance, it immediately retreated.
But now, the VIX's resistance line will soon squeeze all the way down to its support line. As long as the VIX does not break out above the resistance line, it means that its rises will be lower tops than the previous rise.
And, that means that as long as the VIX stays within this triangle pattern, that the S&P can continue to rise.
If the VIX rises above the resistance line, AND the S&P 500 breaks below its support line at the same time, then the market will pull back.
Yesterday: The VIX moved lower toward its Support Level 1. It held within its support and resistance lines, so that coincides with the S&P's rise.
Note: Intra-day volatility on the S&P should start to increase because the VIX now has resistance levels that come faster and faster due to the decline of its resistance line.

Please Note: We do not issue Buy or Sell timing recommendations on these Free daily update pages. I hope you understand, that in fairness, our Buy/Sell recommendations and advanced market Models are only available to our paid subscribers on a password required basis. Membership information


