


A 3-dimensional approach to technical analysis
Cycles - Structure - Price projections
"By the Law of Periodical Repetition, everything which has happened once must happen again, and again, and again -- and not capriciously, but at regular periods, and each thing in its own period, not another's, and each obeying its own law ... The same Nature which delights in periodical repetition in the sky is the Nature which orders the affairs of the earth. Let us not underrate the value of that hint." -- Mark Twain
Current Position of the Market.
SPX: Long-Term Trend - The 12-year and 10-year cycles are still in their up-phases and should continue to influence the long-term trend, but a substantial correction of the bull market which started in October 2002 is probably very near.
SPX: Intermediate Trend - The market is at an important level of resistance which could mark the top of the uptrend which began in July.
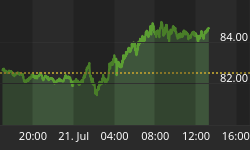
Analysis of the short-term trend is done on a daily basis with the help of hourly charts. It is an important adjunct to the analysis of daily and weekly charts which determines the course of longer market trends.
What's Next?
The last newsletter discussed the Decennial pattern and mentioned the fact that, based on the average performance of the U.S. stock market over the past 120 years, we should begin to expect a major top to develop in this time frame. Is there evidence that we are, in fact, approaching a top?
There was wide expectation that the May top of 1326 in the SPX would be the bull market high, but after making a double bottom in the 1220/1225 area, the index found its second wind and has been pumping uphill ever since, reaching a high of 1372.87 last week: A 148 point move in 4 months without catching its breath, that's impressive! But can it continue? Or is this the blow-off stage of the bull market which started in 2002, to be followed by an extended correction? It could be, for a number or reasons that we will discuss in this letter.
By all measurements the index is very overbought. Carl Swenlin at Decision point (www.decisionpoint.com) recently ran an article which showed that on 10/19 the number of stocks in the SPX above their 200, 50 and 20 DMAs was respectively 78.80%, 83%, and 75.20%. That in itself is not a sufficient reason for a top to form. But when you consider the fact that there is major overhead resistance directly above, it might be.
Andrews pitchfork is a method of drawing channels which encompasses stock prices in a trending market by creating upper, middle, and lower trend lines which act as support and resistance levels on the following weekly chart of the SPX. I have drawn two pitchforks of different lengths: one that represents a very long term channel going back to the 2002 lows, and the other-- which I have shown many times before -- starting with the 10-year cycle low in August 2004. Note how the two red dashed lines indicating the top of each channel are converging around the current price level. Also note that in the smaller channel, the index has retraced on 3 separate occasions as it neared the top line. It would be surprising if this did not prove to be a very strong resistance area capable of stopping the current advance.

The two momentum indicators at the bottom of the chart also show that the market is overbought on an intermediate-term basis. Granted, there is no indication of negative divergence on either, because there has been no deceleration in the powerful up phase which started in July. This could mean that if prices have reached their apex, they could now enter a phase of distribution and trade in a limited range for several weeks before beginning to decline.
I try to get a sense of how far a move will carry by arriving at price projections based on Point & Figure counts taken across the base (or top), and at the same time look for Fibonacci ratios that will substantiate them. If the projection is valid, the market will confirm it by its action. If not, and since there are always several possibilities, I go on to the next one. These projections can often be remarkably accurate.
The earlier SPX 1332 target only managed to provide a temporary halt as prices vibrated for a few days in its vicinity and then moved higher. We have now reached a more important target (1368-1373) which has supporting counts taken across each of the last four consolidation phases, thereby increasing its validity.
Also, when the SPX moved above its former high of 1326, it created Fibonacci projections ranging from 1356 to 1393. These confirm the Point & figure target.
Since these projection levels coincides with the intersection of the two pitchfork channels shown on the above chart, I believe that a top will be formed in this general area. The SPX has already acknowledged the overhead resistance by trading essentially sideways for the past 6 days. The longer it remains in this zone, the more credible these projections become. But because of the recent market strength, I would expect that this sideways pattern will continue for a while longer and probably extend higher into the resistance zone as a distribution pattern takes shape.
If we are approaching an important top, it should be reflected in the indices which tend to give an early warning signal. We looked at those a couple of weeks ago, and I have since added the banking index (BKX) to the lot. The SPX is on the left. The previous bull market top for the SPX, RUT, BKX XBD was in May. The NDX made its high in January and had a secondary top in May. Of the four, so far only the BKX rose marginally beyond its May top, but only to retrace immediately below it in the past week. I think that we can safely conclude that the leaders are not keeping up with the SPX. Granted, they have not yet turned down, but remember that the SPX is just now reaching its projection-resistance area. We'll look at them again two weeks from now.

One more chart deserves to be looked at: that of the VIX vs. the SPX. I do not follow this relationship very closely, but since so many technical conditions point to a top, I wanted to see if this one did as well. It does! As you can see, there is a good reverse correlation between the two indices. The VIX is now reaching a point which has marked previous market tops: how important a top, and how much of a decline, this index by itself does not tell us.

Erik Hadik (www.insiidetrack.com) is a cycle analyst who has a fairly good record. His methodology is unconventional and complex but comprehensive, and it includes CITs based on Gann projections. He had originally thought the bull market high would come about March, but soon afterwards changed his forecast to the time period in which we find ourselves, ranging from mid-October to early November. That was a gutsy call considering that he was going against the traditional 4-year cycle pattern which usually makes its low in October/November. I believe that it is not a coincidence that his forecast for a market top should come at a time when the conditions that I have discussed above also call for one.
Over the short term, the SPX is likely to challenge its high, unless the FED says or does something to de-stabilize the market when it reports its decision next week. Barring such an event, we could continue the current creeping pattern slightly higher into the resistance zone. Structurally, the SPX is making a corrective pattern which will probably result in one more small wave up when it is complete. This small wave may conclude a longer term pattern which began with the bull market low of 2002.
One of the pieces that are associated with important tops is missing: a predominantly bullish sentiment! But we may be getting close to fulfilling this condition as well. At least one indicator has a current reading near 90, and this is bearish for the market.
And then this is the headline of an article which I just received from a friend: "Retail investors missed most of recent rally. But as indexes hit records, individuals have begun piling back in!" By Alistair Barr, Marketwatch October 18, 2006
In my own work, I do not yet have a sell signal. In the daily chart which comes next, you can see that the momentum indicator continues to be overbought and cannot turn down as long as this strong uptrend is in progress but, just like the A/D indicator below, it would require very little negativity on a closing basis to trigger a sell.
Another thing to note on this chart is the steeper and steeper trend lines connecting the reaction lows as the index moved higher and higher. This pattern is unsustainable and invariably results in a correction to the main trend line for a final bounce before breaking through.

So what message is the market sending us right now? I think it's telling us that, at the very least, it may be ready for a pause which could turn into a major top. The next few weeks should tell us if we are at a tipping point.
Summary:
There are many technical factors and conditions pointing to an incipient topping formation:
• An overbought condition
• Strong overhead resistance
• Reaching an important target zone
• Reliable leading indicators clearly lagging
• The near completion of a structural pattern which goes back to the bull market low
• A very good cycle analyst forecasting that we have reached an important top.
The days ahead should confirm this ...or not!


