"Some people drink deeply from the fountain of knowledge. Others just gargle." - Grant M. Bright British-Born American Engineer

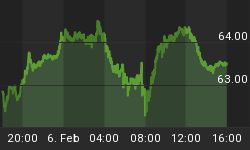
The above chart quite clearly illustrates that Uranium is in a long term super bullish phase. It continues to put in new 52 week highs almost on a weekly basis and is now trading at a 20 year high. One would think that uranium has already moved up too much and that there cannot possibly be much more upside left in this bull. Take a look at the chart below and the outlook changes considerably and if one adds in the supply factor the picture gets even more bullish. Note Uranium has quite a way to go before it catches up to its old high and with all the new nuclear power plants being supply is going to be a massive problem. Current demand exceeds mined supplies by almost 50%; the rest of the demand is being met with above the ground supplies. These supplies are eventually going to run out.

A quick look at this chart illustrates that uranium still has a long way to go before it equals the highs it put back in the 1970's. The true bullish phase will begin when it surpasses these highs. Otherwise one could technically argue that this is nothing but a dead cat's bounce in a long term secular bear market. We personally believe that there is a tremendous amount of upside potential left in this market. One of the main reasons is that it's not yet receiving much public coverage. Every now and then someone mentions it but it's still not the hot story in town.
Contrarians will play this market differently as soon as uranium hits the front pages of major magazines and newspapers they will bail out. At TI where we focus heavily on mass psychology this will not the ideal time to bail out. In fact it's at this stage that the mass feeding frenzy will begin and the ride up though very volatile should produces additional gains of as much as 500%. We will ride it up until our psychological indicators state that the bullishness has reached to an unsustainable level and then we will bail out.
As we have repeatedly stated in the past every potentially great sector is loaded with interesting plays, one just has to know when to position one self in these plays. Today's leaders will not be tomorrow's leaders and some stocks will for the most part remain losers. An example is MYNG in the Gold Sector; from a high of 30 cents in Oct 2003 it's now trading at 1 cent and that's after gold went on to put in series of new 52 week highs.
"The need of expansion is as genuine an instinct in man as the need in a plant for the light, or the need in man himself for going upright. The love of liberty is simply the instinct in man for expansion." - Matthew Arnold 1822-1888, British Poet, Critic
All charts were provided courtesy of www.mineralstox.com


