


Weekly Trader Alert #84
12/25/2006 11:16:49 PM
Overview
Lighter holiday volumes has seen the markets begin a sell-off, which has broken some trend lines and introduces a note of caution to the minds of investors. Overall, it seems that inflation may well be check, but the economy may be softening more than expected.
The week in review:
Monday - NAHB reports homebuilders became slightly more pessimistic, with the index falling from 33 to 32, while it was expected to climb to 34. The NAHB buyer traffic index also fell further, from 26 to 23. This has caused concerns over housing. As an example, TOL brothers bottomed with the broader market on July 18th and since then has risen nearly 50% earlier this month. It has been losing ground over the last two weeks, as investors begin to question that perhaps they got in a little too early.
Tuesday - Thailand's newly installed government imposed restrictions on capital flows causing their equities market to fall 15% in a single day. The rest of the world rejected that control and the Thai government reversed that decision the following day. This is important, primarily, as investors recall the Asian currency crisis started with Thailand's government making a similar move. When will they learn?
Wednesday - Crude oil showed a draw down of 6.3M barrels of oil.
Thursday - Final GDP was revised downward from 2.2% annual growth to 2.0% annual growth. The Chain deflator came in at 1.9% versus the 1.8% expected. The Leading indicators index came in at 0.1%. Jobless claims came in exactly as expected at 315K. The Philly Fed report showed manufacturing activity is contracting in the region, with the index at -4.7 versus and expected +4.0.
Friday - Economic reports reflected strong consumer sentiment and a lack of inflation. Personal spending continued to increase, and was reported at 0.5% versus an expected 0.6%. Personal income rose 0.3% versus an expected 0.4% rise. Michigan consumer sentiment was reported at 91.7 versus an expected 90.2. The core PCE deflator was reported flat indicating no inflation. The main problem with the reports on Friday was the durable goods orders. While they increased by 1.9% versus an expected 1.5%, non-defense orders excluding transportation fell 1.4%.
The durable goods, non-defense, ex-transportation is often viewed as a proxy for business spending/investment. With a negative number, this means businesses aren't investing, which indicates business sentiment may have turned negative, which argues against a soft landing. This could explain why the market sold off today.
Comparing strength of the economy versus interest rates and inflation we have:
- Housing continuing to show signs of weakness with builder sentiment at a multi-year low.
- Automobiles - U.S. manufacturers continue to lag their foreign counterparts, with Toyota overtaking Ford in the number two spot, and now looking at taking GMs lead in the U.S. market in the coming year.
- Manufacturing is contracting. The Philly Fed reported contraction on Thursday, which follows the recent Chicago PMI report and the national ISM report, both of which showed contractions in manufacturing activity.
- Services - continuing to expand but these are lower wage jobs, generally, than the manufacturing jobs
- Tech - Notable tech semiconductor and manufacturers took down their guidance in the past week.
- Interest rates rose in the last week, although this was still modest.
- Inflation looks to be slowing, but is still well above Fed targets
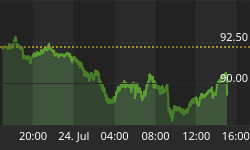
Oil closed down one dollar from a week ago, with a barrel of oil closing at $62.41. Natural gas fell nearly eight cents to $6.635. This was attributed to warm weather and record high natural gas inventories. Overall, we see oil trading in a range of $61 to $64 still. We continue to monitor oil as a wildcard in the soft landing scenario.
To understand more about our view on the markets, we will have to look at the charts.
Market Climate
The market has rolled over. Last week we noted the market continues to rise, and noted there had been no confirmation of a market top. We noted the lack of breadth to sustain the rise in the market, which had been driven largely by large caps. This week, we finally saw that lack of breadth catch up to the market, as equities sold off broadly, and some major uptrend lines were broken.
A chart of the composite of over 8,000 stocks traded on the U.S. Stock markets continues to be included.
The U.S. stock market composite chart:

Price has finally retreated from the upper Bollinger Band and moved below the 20-day moving average. Last week, we suggested a break below the 20-day moving average would call into question the bullish case. In examining indicators on this chart, we note the RSI has reversed from a high level, and has been confirmed by MACD exhibiting a bearish cross and continuation to the downside. The 50-day moving average lies not far below, and this sell-off has occurred on diminished volume. Continuation on greater volume would support the bearish case, and we would suggest a top has been put in.
We think it is useful, this week, to once again, examine the VIX and VXN as to whether the latest market action suggests a top in the market has been put in.
Let's first examine the VIX. You will recall that the VIX applies to the stocks in the S&P-500 and is a measure of implied volatility. In reality, it measures the price premium asked for options, and may be used to gauge market sentiment, principally fear, or the lack thereof.
Let's take a look at the daily chart of the VIX (CBOE:VIX):

The VIX reached a new low on Tuesday and bounced off this level significantly that S&P-500, which actually closed at its high a week ago Friday, and has been sliding ever since, with a rally on Tuesday that didn't reach a new high. We believe that if the VIX puts in a higher close from here, it will likely confirm further downside for the S&P-500 and therefore, the market in general.
Let's take a look at the weekly chart of the VXN (CBOE:VXN):

The NASDAQ-100 has implied volatility measured with the symbol, VXN. The NASDAQ's story is parallel to that for the S&P, as the VXN also rose to meet the upper boundary of its downtrend channel.
With both the VIX and VXN moving sharply upward from the bottoms of their downtrend channels, it is now a matter of if the continue to move upward from here. This would break the downtrends and suggests the markets are in for a new downtrend and that a top has been put in.
We shouldn't have long to wait for this confirmation, and we would expect to see follow-through action to the downside to confirm a top in the coming week.
Now let's move on with our regular weekly analysis.
A look at the chart for the Dow Industrials is represented by the Diamonds ETF (Amex:DIA).

Abbreviations and color key appears below:
Note the following order is Red, Yellow, Green, just like a stop light, so it might be a helpful mnemonic:
Thick Red line represents the 200-day simple Moving Average, (200DMA)
The yellow line represents the 50-day simple Moving Average, (50DMA)
The green line represents the 20-day simple Moving Average, (20DMA)
The light blue line represents the 3-day Moving Average, moved forward three days in time, (3x3MA)
The thick blue line indicates the exponential 13-day Moving Average (13DMA)
Bollinger Bands are abbreviated as BB. There is an upper and a lower Bollinger Band that varies in distance from a central moving average (shown as light red/pink) based on the volatility of stock price movements.
RSI stands for Relative Strength Index. It is an oscillator, which can be used to determine how overbought or oversold a stock may be.
The DIAmonds formed an evening star on Tuesday through Thursday, and then broke down through support on Friday. There is another uptrend line, near the closing price on Friday, which would confirm the downtrend on a further move down. In our opinion, the evening star pattern, followed by the large red candle on Friday on average volume is enough to raise the probability of a continued move to the downside. With seasonal light volume, the average volume reported on Friday is, in context, heavy volume.
Breaking down through the 20-day moving average will confirm further downside action. From there, support should exist at around $122, which is where the 50-day moving average is currently. If that is broken, downside could continue below $121 or even down to $119 in the short term. With the 100-day moving average a bit above $118, we would look at any break below that point to continue to the 200-day moving average at around $115.
The S&P 500 ETF, known as the Spyders (AMEX:SPY) is shown in the chart below:

The chart for the SPYders broke down and closed just below the support of the long term uptrend line. The SPYders broke down through the 20-day moving average and look to be heading lower. Volume was only average, but when adjusted for the light seasonal trading volume, the move was more meaningful.
We have been warning that confirmation of a break hasn't been made over the last two weeklies. Last week, we received that confirmation, and we would be confident shorting the SPYders on continuation to the downside on Tuesday. The SPYders closed on support and a break of this would signal likely downside to at least the $139.50 level, which is the 50-day moving average. The 100-day moving average is all the way down around $136, so a break of the 50-day could see some downside acceleration.
Look for a new trend to start, signaled by a move down for the choppiness indicator.
This week's weekly S&P 500 ETF (AMEX:SPY) is below:

The weekly chart confirms with a bearish engulfing, the downside action indicated in the daily chart. It also indicates the uptrend is exhausted.
This week's NASDAQ 100 ETF (QQQQ) Chart is below:

The QQQQs have broken down through support definitively. This has been the first such sign in five months. The QQQQs are likely headed to the $41.50 range. Examining the chart, you can see the 100-day moving average and former support will align at that level within days.
The choppiness indicator shows a new trend has been strengthening, and that move has been to the downside.
Fundamental Trends
Leaders this week have shuffled quite a bit, with the Steel trade still growing strong (Note: Basic steel dropped one place to sixth) and Oil softening a bit, with two of last week's leaders falling to 11th and 14th place. Meat Products have been steadily marching upward and are now in the leaders, while Fertilizers retook its position and Automation Machinery moved into a top spot.
Examining the top screen (top 31 industries), it is little changed from last week, with one of the four building industries dropping out, but otherwise little change.
The same comments hold from last week that investors are continuing to bet on cyclicals, a continued belief that foreign markets will do well, and are also buying defensice utility and healthcare stocks. Some of this is understandable with the market sliding a bit recently, but investors must continue to be divided on whether we will see a hard landing versus a soft one.
The Industry leaders (ranked 1st-5th out of 190) are:

There are no surprises in the laggards, as the Canadian Exploration/Production industry has been in the bottom screen for awhile. The coal industry has been dwelling in the same area for awhile, but makes its appearance in the laggards this week. The others were there last week or the week before.
Plastics is in last place for the second week in a row, which argues that oil prices are headed higher, as they are the primary raw material in the plastics industry. While it could be a bet against continued demand for plastics, that is about the same things as betting against the sun rising tomorrow. We will continue to watch coal stocks, as they would benefit significantly from a rise in the price of oil.
The Industry laggards (ranked 186th-190th out of 190) are:

Trade Recommendations
We think all the major indexes show promise to be shorted. We would short the QQQQs at the open on Tuesday, and we will issue some stock candidates, as well as perhaps some index trades later in the week.
Sell short QQQQ at the open.
Current Portfolio
We entered into long trades for CTXS and FRK on Monday. Both stopped out for 1.9% and 1.2% losses, CTXS on the day it was entered and FRK on Friday, during the markets push lower. In point of fact, FRK closed at the stop but we set the stops specifically tight on these trades due to the exhausted nature of the markets.
FDG fell through the week but bounced off its 20-day moving average and closed higher during Friday's sell-off. The Close was at $22.93 and we believe that it may find support here and move higher if the market weakness abates.
Generally, our model uses set stop prices to control risk. Index ETFs, including DIA, SPY, QQQQ, and IWM are managed somewhat differently, in that trades will be reversed to time the market, as opposed to using a set stop limit.
Unlike the majority of position trades in the fundamental trader, our ETF trades may see us exit positions prior to specific profit goals being achieved, as we are more concerned with positioning for the correct direction of the market more than with achieving a specific profit level. The reason for this is the profits come over time with a fair number of exchanges for long and short trades.
* Initial stop prices are set to cause us to exit our positions if they close below these levels. You will note they are generally kept pretty tightly the opposite side of the trades we initiate. Historic volatility would imply that intraday price action may trade outside of these values, so that condition is insufficient to cause an exit from an existing position. On significant movement beyond our stop prices, we may issue an intraday message to exit the position or to maintain the position. You may chose to implement an absolute stop below these suggested stop values, but that stop should be wide enough to take care of the daily volatility for the stock in question. You can examine the candlesticks for an idea of intraday price fluctuations.
Entry prices are adjusted to account for dividends paid. The stock price was adjusted by your broker, to reflect the dividend taken out. The non-adjusted entry price reflects the actual entry price, without the adjustment for dividend values.
LVPB Concept: The concept is a Light Volume Pull Back, where a stock's price will pull back to a support level on light volume. Obviously, heavy selling is a sign of weakness, and we would not want to buy on a heavy volume pullback. However, we will occasionally place stocks on the LVPB (Light Volume Pullback List) to indicate a "re-entry" buying opportunity, when we have already entered a position. This should be used to add to existing positions, or to enter a position if you missed the initial entry.
LVPB Portfolio Stocks:
Conclusions
We would be cautious about entering any long positions at this time. We would recommend being short the major indexes, with the QQQQs leading the markets downward, the SPYders ripe to test downward further, and the DIAmonds showing potential to post further losses.
The time period we find ourselves in is seasonally bullish. We found the markets rallied during a seasonally week period during the summer months. We believe there is potential for a short sell-off here, that could develop into something larger. Usually, the end of the year will often set the market off on a new trend. We will be watching in the coming week, to see if we might have a sign of further weakness or a strengthening of the market going into the new year.
For those of you who have enjoyed your subscriptions to the Fundamental Trader and who would like to get additional savings off the price of your subscription, you may consider an annual subscription to the service. You can save nearly 20% off of the monthly rate by selecting the annual subscription price. Just click on the link below:
http://www.stockbarometer.com/pagesMFT/learnmore.aspx
Regards and Good Trading,


