


ASIA REPORT
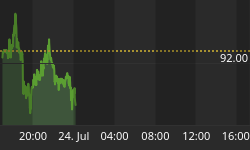
LET'S LOOK AT THE $EUR/YEN DAILY CHART

Last week we identified this move up as the exhaustive phase of this trend and indicated the index would rally 11 trading days and that is when the rally would be at risk. The index made it to a new high on the 11th day and fell back below the break away point. If this move down exceeds 4 trading days it will be the first indication this trend is no longer up.
LET'S LOOK AT THE HANG SENG INDEX

Last week I indicated the uptrend had resumed but to be cautious as there were time cycles that could end the trend Wednesday through Friday. The high came Wednesday and has left a daily exhaustion pattern and a possible "false break" top. There is no evidence of trending down and a distribution pattern could be necessary before a change in trend can occur. But it did exhaust on a cycle high so we really need to be careful. February 1st or 2nd could still be an important vibration in time but I don't know if it can be a high or low and the next window in time is not until March 10th.
LET'S LOOK AT THE ALL ORDS DAILY CHART

Last week we identified a counter trend of three days and indicated if that was a low the index would spike up to either 5760 if the rally was going to fail or 5850 for a possible top. You can see by the distance above the trendline there is an exhaustion of some sort taking place. I would be guessing if I tried to qualify the magnitude of that exhaustion but wave structure indicates there could be one more multi-day correction and one more multi day rally to complete this trend in Mid-February.
LET'S TAKE A QUICK LOOK AT THE US BOND MARKET

The weakness we saw last week and the strength in the US Dollar was caused by a panic move down in US Bonds. You an see this has developed into a vertical move down and until this can move above the low of January 18th or can rally more than 4 trading days this trend will be down hard and a possible panic. So until this market can stabilize there will be pressure on US Stocks.
CNBC EUROPE
There is a pattern of trending present I have been able to indentify or qualify an thought it would be worthy of discussion today.
LET'S LOOK AT THE DAX INDEX FIRST

Both the DAX and the CAC 40 show a pattern of trending that is struggling upward since December. Whenever this index broke to a new high it would immediately dropped back below that high. The move down would quickly find support at a high level and again attempt to breakaway and fail. Whenever there is congestion like this the index is building for a fast move. Supply and demand are becoming equal and one is going to take control. The indication for a fast move up is a low on top of the congestion as I've illustrated on the chart. And an indication of a fast move down is a lower high. You can see the last time there was a similar congestion and the signal for a fast trend up was Mid-October highlighted by the arrow.
LET'S TAKE A QUICK LOOK AT THE CAC 40

You can see this index has the same pattern of trending only the past 7 trading days have shown a further struggle up to reach the last high. This could be distribution before a move down. Be very careful if this shows further weakness. Remember this index was building a possible broadening pattern.
The FTSE continues to be weaker than those two indexes and is also struggling but basically in a sideways pattern that could be developing into a top. Still too early to tell so we need to let these struggling trends be resolved to see the significance of these patterns of trend.
LET'S LOOK AT THE S&P 500 DAILY CHART

Last week I indicated the S&P 500 Index could resume the trend from the pattern of trending but the other indexes had significant moves down and could be showing "false break" tops. The S&P broke out of the congestion and to my surprise immediately reversed and broke the previous swing low. Further weakness will put the index down to the very important 1400 to 1405 support level. If that occurs the index will bounce up from that level and if that bounce fails there could be a fast decline to the 1384 level. But since there are false break patterns in the stock index it would be prudent to be cautious now. This coming Thursday appears significant by "time."
Also, the weakness in bonds was the major reason for this weakness stocks. Bonds are currently in a capitulation or a bit of a panic move down. So watch that US Bond market it needs to get back above the low of the 18th or stabilize before stocks will have a chance of moving up.


