


Market Wrap
Week Ending 2/2/07
Economy
The Labor Department reported an increase of 111,000 additional workers to the employment numbers. The unemployment rate climbed to 4.6%. Factory orders and consumer confidence increased.
Initially the dollar was sold and interest rates rose. After second thoughts, investors bought the dollar and interest rates fell.
The Reuters/University of Michigan index of consumer sentiment rose to 96.9 in January, from 91.7 in December. The Commerce Department reported that factory orders increased 2.4% in December, twice the 1.2% gain in November.
The Labor Department reported that worker's average hourly earnings rose 3 cents, or 0.2%, after increasing 0.4% the previous month.
Fourth quarter Gross Domestic Product increased to 5.0%, up from the third quarter's rate of 3.8%. Personal Consumption rose 4.40%.
Average weekly hours worked by production workers fell to 33.8 from 33.9. Profitability at U.S. companies is shrinking as wages are rising at the fastest pace in six years. The Fed left overnight rates at 5.25%.
Stocks
The Dow was up 1.3% for the week. The S&P 500 gained 1.8%. The Transports were up a large 6.2%. The Utilities increased 2.3%. The transports have now confirmed the new Dow high. This doesn't necessarily mean that everything is perfect in paper fiat land, but a trend is in effect until it isn't.
Right now the averages are performing well. Valuations, however, are off the chart, which warrants a careful watch and approach to the markets.
Also, charts look the MOST bullish just before they turn bearish. Expect the unexpected and be prepared.
My opinion (which could very well be wrong) is that the markets are floating on a sea of liquidity. I track the daily open market operations of the Federal Reserve and they are providing plenty of new money daily.
Any change in the amounts of liquidity that are daily injected into the system would be immediately and strongly reflected in the averages - to the downside. Caveat Emptor.
The first chart up shows the relationship between the performance of the Dow Industrials compared to gold. Gold has out performed the Dow continuously and dominantly.

Next up is a chart of the performance of the Dow Industrials compared to that of the Nasdaq Composite. When the Nasdaq out performs the Dow it means investors are willing to take on more risk: i.e. the riskier stocks in the Nasdaq as compared to the Dow.
When the Dow is out performing the Nasdaq it means investors are leery of taking on more risk and want to own the conservative tried and true blue stocks in the Dow Industrials, as opposed to the new hot shot kids on the block in the Nasdaq.
Presently, as the chart shows - the Dow is out performing the Nasdaq.

Below is a comparison of the Transports to the Industrials. The blue lines indicate the transports are out performing the Dow - red lines indicate the Dow is out performing the Transports.
The Transports have finally confirmed the new Dow high by making a new high as well. This doesn't mean to throw caution to the wind. However, it is a confirmation of the trend, which is in effect until it isn't.

Next up is a chart of the Transports. Confirmation has occurred - but by the smallest of margins, and for the smallest of time. More upside action and a 2 day close or weekly close above such levels are needed for validation of the confirmation.

Bond & Interest Rates
Two year Treasury yields lost 5 bps to close at 4.93%. Both the five and ten year Treasury yields fell 5 bps to 4.82%. Long-bond yields were also down 5 bps to 4.92%. The spread between the two year and the ten year closed the week inverted 11 basis points.
The Fed still has its coveted inverted yield curve - where short term rates are higher then long term rates. All inverted yield curves of the past have always been followed by a recession in the economy. Caveat Emptor.
Prior to this past week's decline in interest rates, rates had been steadily rising. It remains to be seen which way the trend of rates is established.
Federal Reserve foreign holdings of Treasury debt were up a considerable $10.8 billion dollars last week, setting another record of $1.79 Trillion. Custodial holdings are up 16.2% for the year - not an inconsiderable amount.
The first chart below is of the ten year yields (interest rates). It shows the recent breakout in rates that has now been reversed, giving a false breakout of higher rates - at least for the time being. The jury is still out, however. Short term is one thing and long term another.

Next we have the 30 Year Long Bond Price. This is the standard for mortgage rates and other long term debt. The yield on the long bond was down 5 basis points for the week.
However, as the chart indicates: prices are headed downward toward the lower trend line that represents support. If the lower trend line is broken there will be trouble in paper fiat land. Mr. Mortgage will not be happy, nor Mrs. Mortgage as well.

Lastly we note on the interest rate front that although Treasury Yields were down - mortgage rates went up. Not a very good sign. Thirty year fixed mortgage rates were up a considerable 9 bps last week to 6.34%.
Fifteen year fixed mortgage rates were up 8 bps to 6.06%, while one year adjustable rates gained 5 bps to 5.54%. The Mortgage Bankers Association Purchase Applications Index gained 1.3% this week, although they are down 7.1% for the year.
The US Dollar
The US Dollar was up versus the Euro and Yen last week, supposedly based on the speculation that the Federal Reserve will not lower interest rates anytime soon, choosing instead to keep them steady and unchanged.
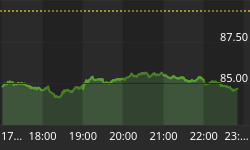
The US Dollar index was down 0.4% for the week, closing out at 84.95. The British pound gained versus the dollar based on speculation that the Bank of England will raise interest rates to slow the economy down, which is expanding at a faster pace then the BOE feels safe with regarding inflationary pressures.
The Yen Carry Trade is alive and well, at least for the moment. The market is short yen meaning it is betting it will fall. The U.S. Commodity Futures Trading Commission reported that net shorts rose to a record 173,005 from the prior record of 164,860 the week before.
International reserve assets, excluding gold were up $833 billion for the week and 20.1% yearly to another record $4.97 Trillion.
Bank Credit was up $1.5 billion to a record $8.309 Trillion to just under 10% for the last year. Bank Real Estate loans are up 14.4% during the same time frame. Sounds like a broken record doesn't it, which is a message all of its own.
First up is the US Dollar chart that shows the horrendous bear market the dollar has been in, and remains in. The recent rally is nothing more than a counter trend rally in a bear market, as the chart clearly illustrates.

Next is a chart comparing the performance of gold to the US Dollar. It is a no contest situation. Gold has been handily killing the dollar. We expect such to remain the case. The dollar is as we say: burnt toast.

The following chart shows the relationship between the Euro and Gold. The price of gold has been superimposed over the price of the Euro. As you can see, the Euro and Gold track each other with a positive correlation.

The last currency chart compares the USD to the Swiss Franc. At the bottom of the chart is the price performance for the Euro and another for Gold. Both show the same correlation versus the Swiss Franc due to the positive correlation of the Euro to Gold shown above.
The Swiss Franc used to be one of the strongest currencies, especially as compared to gold - as it was the last currency to give up gold backing.
Why did the Swiss Franc forego gold backing - because the International Monetary Fund (IMF) passed a by-law that states that no member country can have a currency backed by gold. Now why do you think the IMF did that? Cui Bono?

Oil & Energy
Crude Oil rose to $59 a barrel based on increased demand due to cold weather finally settling in across most of the nation. In many areas the temperature was colder than normal.
Prior to this snap of cold weather, the winter season has been one of the mildest on record. OPEC also plans on cutting production, which coupled with increased demand results in higher prices.
However, as the chart below shows - the recent rally in oil prices appear to be a counter trend rally that will most likely not continue for too much longer. Long term may be a different story. Time will tell.

Natural Gas
The Energy Department reported that U.S. gas inventories are up a huge 21% compared to the five year average. Due to the mild winter so far this year, the larger than normal supply of stored gas is more then adequate for the lessened demand.
Consequently, natural gas fell 5.4 cents, or 0.7% for the week, to $7.476 dollars per million BTU's, as priced on the New York Mercantile Exchange. However, the price of NG has gained 19% in the past month, as we predicted it would.
Did we catch the rise - no we didn't. Another incident of being asleep at the wheel. There is a lesson here, as is obvious. Hopefully we will learn from it for future use.

Commodities
For the week, the CRB index gained 1.8% - still down just under 2% for the year. However, pay heed to the second chart below that paints a whole different picture regarding commodities.
Wheat prices fell 0.5%, the fifth decline in six weeks. However, do not be mislead, as the price of wheat was up 48% last year, reaching a 10 year high of $5.57 in October. We view this as just the beginning of a long term trend.
Corn has exploded upwards 82% from a year ago, supposedly because of demand in ethanol production.
The Department of Agriculture reported that U.S. soybean exports are up 21% in the last year, while soybean prices are up 35% in the past four months. Hmm - seems like stuff we eat is getting more and more expensive.
Copper fell 8.2% to a 10 month low. February Gasoline was up 3.9%. Zinc fell 12%.
The first chart below is of the CRB Index. The second chart is of the CCI Index, which weights all 17 commodities equally. Do note the difference in price and chart patterns.


Gold
Gold closed the week out up .80 cents at $651.50. There was a lot of volatility with prices ranging from intra-weekly lows of $646.60 to intra-weekly highs of $667.20. When all was said and done - it was gold's highest weekly close since July 14, 2006.
Let's get right to the charts. The first one is the daily chart of gold (continuous contract). It shows another false break out, which on the face of it is disconcerting, however, note it was the highest weekly close since July 14, 2006; and remember that there has been a lot of technical damage done by the recent correction - damage that does not get fixed over night.
Time is as important as price. It takes time to work off the overhead supply (resistance) of stock that people bought at higher levels and can't wait to sell out and break even. This is standard bull market counter trend correction behavior, as gold moves from weak hands to strong hands. Patience will be rewarded.

Next is the weekly chart of gold. Here the data is more bullish then on the daily chart, which suggests that this is the last test of the lows or last wave down before the new upward phase begins. Time will tell.

The following chart is of streetTracks gold etf. It too has been performing well. Note the almost identical similarity with gold's chart above.

Silver
Silver closed the week unchanged at $13.38. It had a weekly range of $13.83 to $13.11. It was silver's highest weekly close since December 8, 2006. Below is the daily chart of silver. It is approaching its upper trend line, which is going to offer a good deal of resistance and overhead supply to be worked off. Once again - patience is required.

Gold & Silver Stocks
The HUI Index lost 0.21 cents for the week, closing out at $332.32. During the week it had been as high as $343.56 and as low as $324.38. Another false break out occurred as will be shown on the chart below.
The same caveats apply here as they did to gold. Working off overhead supply takes time. A last correction/consolidation may take place before the new bull market phase begins in earnest. The above $324.38 is our first line of support.

Next up are two charts of the GDX Index. The first is the monthly and the second the daily. The monthly chart shows a very nice long term bullish trend in place.
The daily chart shows a bullish signature as well, however, it also indicates that more work is needed to repair the technical damage and to work off the overhead supply.


HUI/GOLD RATIO
Next is the hui/gold ratio. It compares the performance of the gold stocks in the HUI Index with the price performance of physical gold.
A rule of thumb is that it is better for the gold stocks to be outperforming the gold stocks. Maybe - maybe not, but that is the conventional thinking.

Individual Gold Stocks
There is not much more to be said regarding the various gold and silver stocks out there. Gold is in a bull market - hence gold stocks are in a bull market. You can expect a 3 to 1 return/ratio via the stocks.
We are of the opinion that this gold bull has not even run hard, let alone is it near the end of the race. We are closer to the beginning then the end.
The ride may get bumpy at times, but in the end the sovereign of sovereigns will prevail - as it always has done throughout the ages.
Newmont mining used to be one of the best run gold mines existent. Forever whatever the reasons - Newmont has turned into a sour note - a laagered that no longer keeps up with the other gold stocks. Newmont is heavily weighted in the HUI Index, so its weakness is misrepresenting the true overall condition of the gold stocks. The chart below illustrates the point.

The following stocks (except for Rydex and Gold) are in our personal portfolio. We are looking to accumulate fairly large positions in Rydex Precious Metals using four (4) buys to accumulate incrementally to make up for any bad timing.
We are also looking to buy Yamada and RandGold on any future weakness. The charts are self-explanatory so we will add no comments. Onward to the charts.


Summary
Interest rates are still key, as they affect the bond market, the mortgage market, and the housing market; which in turn affects many peripheral markets such as lumber, copper, furniture, and appliances to name but a few.
Interest rates had been on the rise but began to drop back this week. That is good news for all those that own mortgages - although we did see that mortgages still went up, not down. Hopefully the lesser rates will filter down to the mortgage markets - if the bankers want to play nice, which is a very cold altar to place one's faith in.
The US dollar looks like it could play the lead part in Night of the Living Dead. The counter trend rally is just about over - if it isn't already. Look for the Euro to strengthen.
The Yen is the Yen - the cheapest currency in the world. It is the Yen that is adding to much of the excessive liquidity in the world, as it facilitates the Yen Carry Trade, where money (yen) is borrowed short (at almost zero percent interest rates) to loan or extend long at much higher rates.
The interest rate in Japan is 0.25%, while in the US it is 5.25%. That's a difference or spread of 5%. It's like they're giving the stuff away for free. It is indeed a Brave New World, and a strange one at that. All compliments of the New World Order. Thanks guys - just remember: what goes around, comes around.
Commodities when viewed by the CCI Index using equally weighted goods, show a picture that is far from as dire as the CRB indicates. Might there be one market for us and another for those in the know? Nah - hell this is America: the home of the free and the brave.
Oil has rallied back but it appears to just be a counter trend rally in a continually declining market. This is true for the short term. For the long term we are quite bullish on both oil and natural gas.
Gold and silver are doing just fine. They are correcting and backing and filling as they should. We expect them to continue long into the future.
One caveat that we did not like hearing was the talk of the IMF selling gold. We do not expect it to have a huge impact on prices - but we just don't like it, as it doesn't make sense or cents. We do not have time here to explain.
We are looking for the gold stocks to be on their last minor wave correction/consolidation before Columbia gets ready for take off. If you get the chance - look up the etymology of the word Columbia, it's fascinating stuff. Very occult. Hmm.
We would expect any further pullback to find support around the 135 area on the XAU. $606 - $612 are to be watched on the gold chart to provide support. The HUI 320-310 area provides support. If more then the end wave of a pullback occurs, the charts show what to expect. It's a bull market until it isn't. As of now it is.
Invitation
Stop by our website and check out the complete market wrap, which covers most major markets. There is also a lot of information on gold and silver, not only from an investment point of view, but from its position as being the mandated monetary system of our Constitution - Silver and Gold Coins as in Honest Weights and Measures.
There is also a live bulletin board where you can discuss the markets from people around the world and many other resources too numerous to list. Drop by and check it out. Good luck. Good trading. Good health. And that's a wrap.

Come visit our new website: Honest Money Gold & Silver Report
And read the Open Letter to Congress


