


Market Wrap
Week Ending February 9, 2007
World Economy
This week we are going to emphasize a critical aspect of the global economy - not a rehash of the past week's statistics on this and that, but the real deal, as to what is going on. Needless to say, this is not what the main Wall Street pundits will tell you, or what the elite wishes you to hear or know.
Thus, it is rarely covered by the major news media. Why? - Because they are all owned by the same elite collectivists that profit by the game that's being played out upon the world stage. History may not repeat - it does, however, rhyme. And the name of the tune is reminiscent to the one the Jokester whistles, as he crosses by the graveyard on a cold Saturn-alien night - on his way to the House of Weir.
When the gold bull market began in April of 2001, gold was trading at $256. At that time it required $0.88 U.S. dollar's to exchange for (buy) one (1) euro. Since then, the U.S. dollar has fallen almost 50% compared to the euro. It now takes $1.30 to exchange for one euro. The price of gold is presently at $672.30.
In 2001, the current account deficit was $430 billion. By the end of 2006, the deficit more than doubled to $902 billion, and is expected to soon pass the one $TRILLION dollar mark. The deficit was equivalent to approximately 4% of the gross domestic product back in 2001. Now it is approximately 7% AND growing. This is NOT a good trend.
A significant question they may want to address at the G7 meeting this weekend is why a falling U.S. dollar has not reduced the deficits? Is the price of gold simply going up because the value of the U.S. dollar is going down? Or is there some other dynamic in play?
Gold is up in price in almost ALL foreign currencies. This is NOT just a US dollar-centric gold bull. So what's really going on?
The debasement and loss of the dollar's purchasing power (95% since the Fed took control in 1913 - how do you think you would do with that record on your resume) has hidden and abetted the EXPORT OF DOLLAR INFLATION to other FOREIGN NATIONS. This is why the world is afloat on a sea of dollar liquidity - it is what the U.S. now produces the most of - debt.
The current account deficit and capital account surplus help to HIDE and DEFLECT the very real INFLATION that is occurring. Instead of price inflation there is now ASSET INFLATION AND BUBBLES WORLDWIDE.
Be not deceived - those in charge know exactly what IS GOING ON. Hell - it's their actions that have been, and is the cause of it all.
The Federal Reserve was BORN TO BE WILD AND INFLATE. The Federal Reserve was BORN TO DEBASE THE PURCHASING POWER OF THE DOLLAR. That's what they do. Why? Cui Bono. Follow the money.
PAPER FIAT DEBT-MONEY IS A WEALTH TRANSFERENCE MECHANISM THAT SIPHONS WEALTH AWAY FROM THE MASSES AND TO THE ELITE FEW AT THE TOP OF THE FOOD CHAIN.
IT IS A HIDDEN FORM OF TAXATION - OF TRIBUTE PAID TO THE MAN.
There has been much talk lately, about the U.S. dollar's demise, as the world's reserve currency - be it intentional or not (that's correct - you read that right: intentional or not). Why - Cui Bono? Perhaps the Elder's were correct. The world is floating on a sea of US dollar liquidity.
But now, foreign nations are beginning to sell, or as a bookie would say: lay off the risk of holding their huge dollar reserves or bets - to "another", any other.
And it is beginning to get even worse. Now foreign entities are not just selling their excess reserves of U.S. dollars, some are not accepting them period. Both Venezuela and Iran presently demand payment for oil in euros - not in U.S. dollars.
Russia has publicly stated that it is in the process of reducing its dollar reserves. Some claim the reason why the United States went to war with Iraq was to protect the U.S. dollar - as Iraq no longer was accepting the dollar in payment for oil. Such audacity must be taught a lesson the world can witness and learn by.
Russia's foreign currency and gold reserves just hit another new record: $304.6 billion. The reserves are the third largest in the world. Any you thought the cold war had killed the bear. Think about it. Knowledge is power - empower yourself. Then vote accordingly.
The euro has now surpassed the dollar in terms of currency in circulation ($787 vs. $753 bil). Outstanding bonds are estimated to be $4.7 vs. $3.9 trillion. OPEC is running a total current account surplus of $500 billion a year. Oil exporting nations are projected to have surpluses of $1.7 TRILLION by the end 2007. China's foreign currency holdings were $1.0 trillion at the end of 2006, and growing daily.
Perhaps at the G7 meeting they should be asking the question: which will have more of an impact on the value of the dollar AND the value of GOLD: China's potential reduction of excess dollar reserves, or the Middle East oil exporter's holdings of foreign reserves; and even more importantly - what currency they ACCEPT in payment for OIL. Then consider the combination of ALL THREE occurring at the same time. Not a pretty site.
European Central Bank President Jean-Claude Trichet said that the ECB would raise interest rates next month if the pace of growth increases inflation. He said that: "strong vigilance remains of the essence so as to ensure that risks to price stability over the medium term do not materialize."
The Persian Gulf state's central bank reported that the Saudi Arabian Monetary Agency increased its foreign currency reserves by 40% in the past year. The reserves now stand at $239 billion.
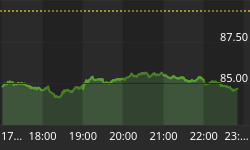
The Dollar Index has rallied off of oversold lows of 82.00 made in December. Since then it has rallied up to overhead resistance at 85.00. Gold has held up extremely well during the dollar's recent COUNTER TREND rally. Many have been whining about gold's recent performance, which when viewed in the above context is actually QUITE BULLISH.
Now, the dollar is beginning to turn down from the 85.00 level. As the chart of the dollar in the currency section below shows, this is its 200-day moving average, which has been formidable overhead resistance for quite a while now. It was once support, but once broken - supports turns into powerful overhead resistance/supply.
Remember playing the mambo - how low can you go? Some say its possible for a downside dollar target of 60.00. Some say lower. Some say higher. Some even say the dollar may go the way of all paper fiat currencies - as in bye, bye. Which way do you care to place a wager on?
Myself - I'm betting on the oldest, soundest currency in the entire history of the world, one that has NEVER LOST PURCHASING POWER - GOLD.
The Dollar Index is at a crucial chart point. It's in the process of testing its falling 200-day moving average. The U.S. dollar has been trading below its 200 dma, which has now become long-term resistance. The rally of last fall in 2006 failed at the 200-day line. Now the 200 dma has repelled the most recent rally. What the dollar does from here will affect all of the markets.
One of the obvious factors influencing the direction of the dollar are interest rates. Bonds move inversely (opposite) to interest rates. When interest rates rise - bond prices fall. When interest rates fall - bond prices go up.
The recent dollar rally began in December 2006. At that same time U.S. bond yields (interest rates) started to rise. The 10-year Treasury note yield (TNX) has now fallen back below its October high (4.85%) and its 200-day moving average. Falling interest rates means rising bond prices.
The caveat, however, is that falling interest rates have a deleterious effect on the dollar - to the downside. U.S. interest rates MUST STAY COMPETITIVE with the rest of the world's major currencies to attract buyers of our DEBT. It's known as the currency devaluation game - and who ultimately gets left holding the bag.
This is the corner the Federal Reserve has painted us into. The dollar is damned if they do - and damned if they don't. Like the song says: Goddamn the pusher-man - cause he doesn't care if you live or die. The easier it looks - the harder it hooks. There ain't no such thing as easy money.
At the G7 meeting the German Finance Minister Steinbrueck put hedge funds on notice, voicing concern that the expansion of the $1.4 trillion industry threatens the stabilization of the global financial markets, and could have unwanted effects. Henry Paulson, who should know a bubble when he sees one, said, "the funds deserve to be scrutinized." Spoken like a true raconteur.
European Central Bank President Jean-Claude Trichet warned against making "one-way bets," a reference to the carry trades, which is when investors borrow short to buy long. This is where Japan steps in as the land of milk and honey, with interest rates at 0.25% - the lowest in the world.
Investors can borrow at 0.25% and turn around and buy U.S. Treasury debt paying 5.25% - and you thought investing was difficult: not when WE subsidize it. Trichet followed with: "these trades are not appropriate." The more this guy talks, the more I like him, however, he doesn't sound like any other central banker, which tends to keep me at bay. I would suggest watching what he does and not what he says. Time will tell.
Gold Stocks
The HUI Gold Stock Index gained 7.74 points to close the week out at 340.06 for a weekly gain of 2.33%. It was the highest weekly close since December 8, 2006. Intra-week the index was as high as 347.13, which shows there is still overhead supply to be worked off.
The daily chart below indicates this quite clearly. You can see that intra-day on Friday the index hit its upper Bollinger Band and then fell back. This may be a hint that a short-term consolidation/correction may be in the cards. We shall soon know.

Next up is the weekly chart of the index. The HUI is approaching it upper trend line and needs to break out above it and stay above it before the next bullish leg up can begin in earnest.

Next we have another different weekly chart showing the long-term trend and the importance and excellent buying opportunities provided by the 65 week moving average. The weekly chart is followed by the monthly, which shows the heavy support levels that are present further below.
However, the monthly also shows a lot of work needs to be done via the RSI and other indicators. Note the three (3) negative cross overs at the bottom of the chart. These must be repaired by sustainable upside action.


Next is a point and figure chart on the Hui Index. It shows a triple top breakout on Feb 9, 2007 with a bullish projected price of 380.

Below is the Hui to gold ratio chart. It compares the performance of the gold stocks to the performance of the physical metal gold. The chart has mixed signals. Higher lows are in place, however, now higher highs are needed - or at the minimum the higher lows need to remain intact.

Next is the XAU Gold & Silver P&F chart. It is showing a double top breakout on Feb. 9, 2007 with a projected price target of 162.

Gold
Prices rose to the highest weekly close since May 12, 2006. Gold was up $20.80 (continuous contract) to $672.30 for a gain of 3.19%. Gold has broken out of its symmetrical triangle formation and closed above its upper trend line.
This past week saw gold rally impressively. However, there is fairly strong resistance at the $675 - $680 level. The July high at 676.41 is the next upside target.
Now that the important $655 resistance level has been broken above, we look to see if this level now becomes support on any future consolidation/correction. If gold violates $655 then the $644 level offers the next line of support, and then $630. The daily chart below shows the various levels.

Next we have the long term weekly chart of gold, which shows the importance of the 65 week moving average - both as defining the trend, and as representing the best buying opportunities on any corrections that go down and kiss it.

Below is the point and figure chart for gold. It shows a double top breakout as of Feb. 9, 2007 with a projected price of $790.00.

Next is the chart for GLD - the gold trust shares exchange traded fund. The chart is self-explanatory and needs no further comments.

Silver
Silver had a good week, closing up 0.54 cents to $13.91 for a weekly gain of 4.04%. The first chart up compares the performance of silver to gold. Since July of 2006 silver has been out performing gold. It appears that the out performance is slowing, and may (??) be starting to swing the other way. We will watch with interest to see what develops.

Next is the daily chart of silver. It shows it approaching its upper trend line. The trend line needs to be taken out, as does the 14.37 resistance level.

Below is the iShares silver trust exchange traded fund. It looks almost like a copy of the above silver chart.

The long term weekly chart of silver shows the importance of the 65 week moving average both in regards to defining the trend, as well as showing that the best buying opportunities have been when silver has fallen and touched the 65 week average, and or even broke below. Buy weakness and sell strength in a bull market is a hard plan to beat.

Last up is the P&F chart for silver, which shows a bullish price projection of $21.50.

Harmony Gold Mining
I have received quite a few emails regarding Harmony. Obviously the question is what's up, as in when is it going to go up. I can't provide a definitive answer as to the time factor. All I know is that I own a fair amount of it, and that my plan sees it at a much higher level within a year's time, which is fine with me. I'm in no rush. Whatever the market gives - I'll try to cooperate with and receive.
First the P&F chart which shows a bullish price objective of $27.50. I'd be more than happy with 80% of that gain.

Next up is the daily chart of Harmony. It may (???) have put in an intraday low on Thursday Feb. 8, 2006 at $12.83. We should know quite soon whether this holds or not. Sometimes you hit pivots and sometimes divots.

Coeur D Alene Mines
CDE is another one I've received many questions on - like what the heck is up - as it isn't. Everyone just loves to hate little old CDE, which tends to make me hate to hate it. First up is the P&F chart, which gives a price projection of $15.75.

Below is the daily chart for CDE. It shows some positive divergence and a positive MACD Cross Over. A higher low has been put in place. Let's see if she rises to the occasion.

Eldorado Gold
Next we have Eldorado Gold. It has been performing well, and may (???) be forming a cup with a handle - a bit more upside action is needed, and then sideways consolidation to form the handle. Note the increase in volume at the end of the chart. We like that. The stock is under accumulation.

Gold Fields
The last chart (yes you can soon rest the tired eyes) is Gold Fields. It hasn't YET lived up to our expectations; however, we do expect it to. The chart below is a P&F Percentage chart, NOT a P&F Standard chart.
The percentage chart below shows a double top breakout on Feb. 9, 2007. A standard P&F chart does NOT show this breakout; as a matter of fact it as bearish. Caveat Emptor.

Summary
As always, interest rates remain key, as they will determine what bonds and the dollar do, and the other markets will cue off them. We note the recent problems in the sub-prime mortgage markets. Could this be a harbinger of things to come - as in a contagion that spreads? Only time will tell.
We are paying close attention. We also feel quite secure in storing wealth in gold - the sovereign of sovereigns, which is outside of their paper fiat monetary system of debt-money.
The G7 meeting was this weekend. Talk has been will they or will they not officially admonish Japan to do something about its zero rate interest policy - as in raise rates. Mr. Paulson shot a warning over the bow before leaving for the meeting, suggesting to others to stay clear of open criticism of Japan.
Now why could that be? Perhaps Mr. Paulson has had an epiphany, and he no longer worships at the feet of the paper fiat monetary god: Lucre. We will be pleased to take any bets on that one.
We find it both sad and amusing that China is as always - in the hot seat for currency issues. Everyone else seems to be able to do what they want to do with their currency - but not China. Another conundrum? We think not. As always - Cui bono and follow the money. It always returns to the same Houses marked by the Dog Star - the House of Dogon or Dagon. Check it out.
Getting back to less stellar topics - China, as in the G-7 statement in September, was the sole country whose currency was singled out for criticism. The G-7 stated that the yuan was to show "greater flexibility" and to "move" more on a trade-weighted basis to help close global trade imbalances.
We find it amusing that anyone can be dumb enough to think that China's currency has that much effect on the global imbalances that exist when it is the HUGE AND MASSIVE amounts of U.S. Federal Reserve Notes that have floated the world with excess liquidity that is at the root of the problem.
It is the profligacy of the U.S. dollar and other credit and debt issuances that are the cause of the worldwide inflationary asset bubbles that are occurring. And, as we noted in the opening section on the global economy - it is our deficits that hide the true nature of the debasement and loss of purchasing power of the U.S. dollar that is INFLATION PERSONIFIED. PERIOD. OUR LEADING EXPORT IS INFLATION.
If anyone should clean up their currency mess it is the United States, as we are the world's reserve currency - yet we our the world's largest debtor. Think about it - real hard. It's not like it's rocket science. The central bankers still have their jobs and look at their performance.
Which naturally brings us to gold: the sovereign of sovereigns - the oldest and most sound money in the world; and it may be hard to believe, as it isn't taught in school for some unknown reason, but the Constitution mandates that only gold and silver coin is legal tender. Imagine that. Then why do we use paper fiat monopoly money? Could it be so that someone gets to win the game of monopoly? Cui Bono? Follow the money.
Invitation
Stop by our website and check out the complete market wrap, which covers most major markets. There is also a lot of information on gold and silver, not only from an investment point of view, but also from its position as being the mandated monetary system of our Constitution - Silver and Gold Coins as in Honest Weights and Measures.
There is also a live bulletin board where you can discuss the markets from people around the world and many other resources too numerous to list. Drop by and check it out. Good luck. Good trading. Good health. And that's a wrap.

Come visit our new website: Honest Money Gold & Silver Report
And read the Open Letter to Congress


