


Below is a copy of our March letter to clients. To receive these updates free every month via email, visit out Contact Page an submit you email address at the bottom. For more information about Sitka Pacific, visit our web site at www.sitkapacific.com or email us at investing@sitkapacific.com.
March 2007
Dear Investor,
We had a positive first quarter in 2007, with Hedged Growth accounts gaining 3% on average after fees and High-Yield Growth accounts gaining 1% on average after fees. Our core portfolios were fully hedged and market neutral during the last three months, and these gains were largely due to the spread between our long and short positions, and gains in Treasury bond and gold positions. Since hedging activity varies somewhat from account to account, you're results may be slightly different from the average.
The S&P 500 rallied in January, declined in February, and then rallied in March to end the with a 0.2% gain for the quarter. Treasury bond yields traded higher and lower during the quarter and ended with the yield on the 10-year bond at 4.65% - near where it started. The US Dollar fell 2% against a basket of other major currencies, while gold remained bound in a trading range that began in May of 2006.
Many of the emerging trends in the economy and the markets we discussed in the 2006 Annual Review came to the forefront in the first quarter of 2007. The continuing deterioration of the housing market has been making more headlines recently (more on this below). The Federal Reserve has held the Fed Funds Rate steady at 5.25%, which remains above the rest of Treasury yield curve beyond 6-month T-Bills. And after a six month period of record-low volatility in the stock market, the magnitude of the daily swings is picking up.
* * *
To those who have been watching the data over the past year, it's not surprising to see the continued deterioration of the housing market and its effects on sub-prime market 'fringe.' There have been several high profile implosions of large sub-prime mortgage lenders over the past few months, as the rise in the percent of sub-prime borrowers who are delinquent in their payments has forced these companies to buy back more of the securitized mortgages from the bond market than they have cash to cover. This is a direct effect of the reset of many adjustable rate mortgages to higher interest rates (which increase monthly payments on these loans) and the national stagnation and localized decline of home prices (which limit these homeowner's ability to sell).
We looked at a chart of New Housing Permits in the 2006 Annual Review, and I mentioned then that permits tend to lead both actual new Housing Starts and New Home Sales, which in turn tends to lead changes in national median home prices. The below to the right shows New Home Sales and Housing Starts from the start of 2005, and you can see how dramatic the decline has been. Housing Starts have declined from a peak near a 2.3 million annual rate to a 1.4 million annual rate in early 2007 - a 40% decline in new home construction in a year. The most recent figures for New Home Sales in February show a continued decline from January's level shown in the chart to an 848,000 annual rate, the slowest since August 2000.

Since we do not hold any long positions in home building, real estate or mortgage lending, you may be wondering why we have focused on the housing market over the past few months. In a nutshell, here is the reason. There has been a vigorous debate raging about whether this weakness in the housing sector will eventually spill over into other parts of the economy. Some think that the current problems in the sub-prime market will remain contained and will not adversely impact the rest of the housing market or have any significant affect on consumer spending, which drives 70% of our economy. Some also think that the downturn in housing construction (and all the related economic activity, from financing to Home Depot trips) will not be big enough to bring the economy into recession.
These are all good things to hope for and if these predictions become reality then we will all be much better off for it. However, there is no reason to let our financial well being depend on a perfectly executed economic 'soft landing' in the housing market. From a risk management perspective it is prudent to assume these trends will play out as they have in the past, and plan accordingly.
So the question is: how have these trends played out in the past? The chart below gives one answer. It shows the year-over-year percent change in Residential Fixed Investment, adjusted for inflation, which is a measure of physical goods purchased and investments made for residential (non-commercial) use. We can see on the far right that Real Residential Fixed Investment is now in solid negative territory, which reflects the steep slowdown in housing-related investment and activity. We can also see that in 3 out of the 4 past instances over the last 26 years when we ventured into negative territory a recession followed (shown by the shaded bars in the background).

The shallow dips into negative territory in 1995 and 2001 (grey arrows) were not driven by a significant slowdown in housing, but were largely side effects of other economic events. In the light of this we can see that of the two previous housing-initiated downturns of Residential Fixed Investment in the past 27 years, in the early 1990's and early 1980's, each produced a significant drop in Real Residential Fixed Investment similar to what we are seeing now. In both instances a recession and bear market following shortly thereafter.
The impact of the dot-com bust 7 years ago was felt throughout the entire stock market and had a major impact on the economy, even though it started out as an isolated sell-off in a relatively small number of extremely over-priced technology stocks. Those who argue that the downturn in the housing market will remain contained and not affect the rest of the economy are up against what past experience tells us is likely to happen. At this point, until we see real evidence to the contrary, there is every reason for us to assume there will be a broad economic fallout from this housing downturn that will impact many sectors of the market beyond sub-prime mortgage lenders and the homebuilders.
* * *
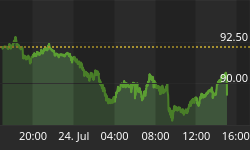
Last month's update was sent out just a day after the Dow had its one-day 416 point drop, and since then there has been an increase in volatility both on the downside and the upside. You can see on the chart below of the S&P 500 (solid line) and the Nasdaq Composite (dotted line) the difference over the past month versus the slow but steady climb higher through most of February. You'll also notice that the broader market is basically where it was in late November. While the market has so far held itself together reasonable well, the past couple months have shown how quickly things can change.

After their March meeting, the Federal Reserve announced they were holding the Fed Funds rate steady at 5.25%. In the accompanying statement they removed a short comment from their previous statement - an edit which was interpreted to mean they were closer to cutting the Federal Funds rate than before. The market rallied in response (the big spike up on the far right of the chart), with the major stock averages recovered a good chunk of their decline from February.
Whether this buoyancy will last beyond a few weeks is anyone's guess. In subsequent speeches Fed officials have made it clear they remain primarily concerned about inflation, even though the housing market is clearly deflating and other recent data suggest at least an economic softening. In recent testimony to congress, Fed chief Ben Bernanke said "Our policy is still oriented towards control of inflation, which we consider at this time to be the greater risk." Translation: the Fed has no current plan to cut rates, regardless of how much the market wants it.
With the Fed focused on inflation, it's clear the housing market and the economy will have to live with short-term interest rates above 5% for the time being. We'll probably look back at this time a year from now and see that the Fed was either behind the curve in reacting to the emerging weakness in housing and the economy, or they were ahead of the curve by remaining focused on inflation while the economy went through a 'soft-patch' brought on by the housing market and then recovered.
The latter outcome would be a striking exception to our recent economic history, so we'll maintain a healthy skepticism for the time being with your account hedged accordingly. If the economy manages to avoid a housing-led recession, it would clearly leave room for stocks to gain once the current volatility subsides. If the economy doesn't manage to avoid a recession, it's equally clear stocks have yet to discount such an outcome.
That's all for this month's update. As always, if you have any questions about your account feel free to contact me anytime.


