


Index Advisor 026
4/2/2007 8:37:03 AM
Recommended Trades:
We have seen the pull back and the market looks to be setting up for a move upward to test resistance, which lies just overhead. Unfortunately, our mid-day entry worked against us, even though we were correct that the market would move down or consolidate from Thursday.
Open Positions:
In general, once we have entered a position, we will issue an alert to exit the position. We will note likely target areas for a trade, but we buy and sell on signals, rather than target areas. The same method applies to stops, as we don't use classical stops, but rather rely on the signals generated to reverse or exit our positions.
Symbol | Position | Entry | Current | Dollar | Percent |
DIA | Cash | $122.82 | $123.59 | -$0.77 | -0.6% |
IWM | Cash | $79.00 | $79.51 | -$0.51 | -0.6% |
QQQQ | Cash | $43.53 | $43.53 | $0.00 | 0.0% |
SPY | Cash | $141.20 | $142.00 | -$0.80 | -0.6% |
Overview:
Ready, set, stop...
Friday marked the end of the quarter, leaving the indexes little changed for the year. The Dow is down slightly for the year, while the S&P and NASDAQ are actually up modestly. The Russell-2000 (2000 of the largest small cap stocks) actually shows gains of around three percent year-to-date, flying in the face of those talking heads suggesting that it is time to abandon small cap in favor of the better returns they argue will derived from large cap ownership.
Last week we reported that the market interpreted the Fed's policy statement as indicative of an imminent rate cut. We suggested that investors got it wrong and that the change in language for the Fed policy statement was just that, a change in language. Nothing indicated a rate cut was likely. We also suggested that investors were ignoring the full impact of the sub-prime morass, as twenty percent of loans written in 2006 were sub-prime. We also noted signs of rising inflation that were being ignored. Well, all of this came back to haunt investors this week as it became apparent that they had misinterpreted the Fed's statement.
To understand what transpired in the week to dash hopes of an imminent rate cut, let's review economic reports released during the week.
Monday: The only economic report released Monday was new home sales, which were reported at 848,000 versus an expected 995,000. This miss by 15% isn't the norm as the homebuilders have the opportunity to take down their forecast before the report is compiled and didn't choose to do so. This means that weather should not have been a factor, as the homebuilders can react to weather and take down their forecasts. There have been large downward revisions in these numbers for the last three months. Unsold inventories rose to 8.1 months from a previous high of 7.2 months. Median prices are only 0.3% lower than a year ago, while average prices are 7.5% higher, year over year. This indicates starter homes aren't selling which is linked to the sub prime woes.
Tuesday: Before the market opened, Lennar (a homebuilder) announced a miss on their earnings and removed their 2007 guidance. There was also a speech by a Fed official on the sub prime market, indicating sub prime borrowers would likely struggle for the next two years. On top of this, the Conference Board's consumer confidence number fell short of expectations, falling five points to 107.2, versus an expected 108.5. All three of these things suggest concerns for the economy going forward.
Wednesday: Before the market opened, durable goods orders were reported up 2.5%, which missed the consensus 3.5% increase expected. This actually showed a drop of 1.2% in non-defense spending excluding transportation, which is a proxy for business investment. This followed a drop of 7.4% in January. Fed Chairman Ben Bernanke addressed Congress and essentially confirmed that the market had misinterpreted the Fed's policy statement in their expectation of a Fed rate cut in the near future. Compounding concerns in the sub prime lending space was Beazer Homes (NYSE:BZH). Business Week reported that Beazer is being investigated by several government agencies on various fraud charges. In addition, the price of a barrel of crude oil raised more than a dollar to break out of its trading range and closed at $64.08. This was due primarily to tensions from the situation in Iran, after they took fifteen British sailors prisoner.
Thursday: Thursday's economic reports were positive. Initial jobless claims were reported at 308K versus an expected 320K. While week-to-week volatility is normal for this report, it still is the lowest number of claims reported in two months. The Final GDP number for Q4 was revised upward from 2.2% growth to 2.5% growth. The Chain deflator came in as expected at 1.7%. Additionally, oil rose nearly two dollars to close at $66.03.
Friday: The economic reports were mostly positive with personal income and spending reported at increases of 0.6% versus expectations of a 0.3% increase. Michigan consumer sentiment came in slightly below the consensus estimate of 88.8 at 88.4. Construction spending was reported with an increase of 0.3% versus an expected decrease of 0.6%. Finally, the Chicago Purchasing Managers Index (PMI) was expected to post a 49.5 reading, improving from the last two months reports, but still showing an economic contraction (any report below 50 shows contraction). Instead the report reported 61.7, showing a 14% leap!
Digging further into the regional manufacturing report, the volatile Chicago PMI not only blew out the headline number, it showed new orders leaped from 48.7 in February to 72.2 in March! Production rose from 51.2 to 64.9 in the same period. Employment actually decreased from 50.6 to 45.0 while prices paid dropped from 63.2 to 59.1. Overall, this shows marked improvement in the Chicago region. Monday's national ISM report will show if there is an improvement nationally, or whether manufacturing continues to show contraction overall.
The most important non-headline number on Friday is that inflation rose as expected with the Core PCE deflator rising some 0.3%. Even though this was in-line with expectations, it raises the year-over-year rate to 2.4%, well above the 2% figure the Fed may find acceptable. It virtually rules out a Fed interest rate drop for the time being, validating Fed Chairman Ben Bernanke's comments in front of Congress earlier in the week.
It is worth reviewing the PCE (Personal Consumption Expenditure) deflator, as it is believed to be the Fed's primary gauge on inflation. Take a look at the graph below (courtesy of Briefing.com).

Note that the level of inflation has now reached a level that has been seldom reached since 1993. Examining the highlighted range, you will note that there were a few occasions where the Core PCE deflator traded in the range where the inflation rate was between 2.4 and 2.6%.
As long as the deflator can reverse from this level, the Fed may not act to raise the Fed Funds rate. It is a virtual certainty that members of the Fed are uncomfortable with the rate at its current level and will act if it moves higher, especially higher than 2.6%, which is the top of the highlighted range. We believe the Fed may act sooner rather than later to curtail a further rise in the Core PCE deflator, if the March deflator moves higher from here. This is because the PCE deflator doesn't take into account the rise in energy and food prices that are quite evident today, and are already squeezing consumers.
As we have stated many time previously, the rise in food prices has about twice the effect on consumers as energy prices, and has been increasing significantly for a year of more, with no sign of letting up. The increase in food prices has, to a large degree, been driven by the use of corn in the manufacture of ethanol in the United States. This raised corn prices, wheat prices (due to the planting of corn rather than wheat), meat products and dairy products (corn is used to feed livestock), etc.
We continue to monitor the Yen dollar exchange rate. In the last week, the Yen strengthened to around 117.50 to the dollar from above 118. The inflection point where there would likely be a massive unwinding of the carry trade is between 114 and 115.
The weakening of the dollar may be in anticipation of the Chinese selling dollars in reaction to the imposition of tariffs on Chinese goods by the United States. In particular, protectionist sentiment has been on the rise, and this is an instance of it.
Congress passed this legislation due to the fact the paper industry in China is predominantly a government owned/controlled industry. The Chinese government is subsidizing the industry, due to inefficiencies in it. The alternative to the subsidies would be for a spike in unemployment in China as workers were furloughed. Instead, the subsidies are provided and the goods are sold below cost on the world market, thereby hurting the paper industry participants who are not subsidized by their governments.
Where will this protectionist legislation and sentiment lead? We would suggest that free markets are highly efficient. Imposing tariff's on imported goods moves away from free markets and therefore away from efficiency. It would be much better to work out the subsidization of this industry by the Chinese government, and have them focus on improving the efficiencies in their paper industry, or migrate the workers to other jobs. Introducing tariffs will hurt global trade.
Oil gained close to four dollars for the week, closing at $65.87. Natural gas added about thirty seven cents to close at $7.773. This was mainly due to tensions in the Middle East due to Iran's seizing fifteen British sailors during the week and the escalating tensions due to that. You will recall that Iran' continues to defy the United Nations mandate to cease their nuclear enrichment program. Israel, the United States, and the UK are said to be considering all options, including simultaneously attacking Iran's nuclear and military targets in order to defuse the threat.
Market Climate
The last week has seen weakness shown through the week. The latter half of the week has seen an improvement in price, but internals haven't supported any sort of broad advance.
Only small caps are performing in a bullish manner desperately trying to move upward as some investors find the risk reward ratio attractive. With so much concern over rising inflationary numbers, as well as geopolitical concerns over a trade war with China and a possible shooting war with Iran, the markets still haven't fully come to grips with the risk, but are starting to back off a bit from completely ignoring that risk.
A look at the daily chart for the Dow Industrials is represented by the Diamonds ETF (Amex:DIA).

Abbreviations and color key appears below:
Note the following order is Red, Yellow, Green, just like a stop light, so it might be a helpful mnemonic:
Thick Red line represents the 200-day simple Moving Average, (200DMA)
The yellow line represents the 50-day simple Moving Average, (50DMA)
The green line represents the 20-day simple Moving Average, (20DMA)
The light blue line represents the 3-day Moving Average, moved forward three days in time, (3x3MA)
The thick blue line indicates the exponential 13-day Moving Average (13DMA)
Bollinger Bands are abbreviated as BB. There is an upper and a lower Bollinger Band that varies in distance from a central moving average (shown as light red/pink) based on the volatility of stock price movements.
RSI stands for Relative Strength Index. It is an oscillator, which can be used to determine how overbought or oversold a stock may be.
The daily chart shows the DIAmonds consolidating below the short term downtrend line. We expect such a challenge in the coming week. If it is unsuccessful, we see a larger move downward is in store to test the previous low or perhaps even to the 200-day moving average. A successful push above the 100-day and 50-day moving averages would likely move to the upper Bollinger Band and set up a test of the recent high. If that is also successfully breached, the DIAmonds could begin walking the BB upward.
The S&P 500 ETF, known as the Spyders (AMEX:SPY) is shown in the daily chart below:

The daily chart of the SPYders looks similar to the DIAmonds but the SPYders have been able to maintain closes above the 100-day moving average. The recent high lies not far overhead, which is coincident with a major resistance level. These lie above the short term downtrend, which represents immediate resistance. Also of note is the possibility of a bearish cross of the 50-day MA below the 100-day MA. This could occur next week if the SPYders move down and would accelerate any downside move.
This week's NASDAQ 100 ETF (QQQQ) Daily Chart is below:

The chart for the QQQQs shows the 50-day MA is poised to cross below the 100-day MA. This would likely lead to an acceleration to the downside. However, an abrupt move upward in price here would avert that and would be quite bullish if it was able to continue upward past the recent high.
Of concern is the semiconductor index which we show below:

Examining the weekly chart for the Philadelphia Semiconductor Index (SOX) shows how close price is to breaking below the lower channel line. Last week's bearish engulfing suggests a further downward move is likely. This would contribute primarily to the NASDAQ but if the NASDAQ retreats further, it will likely lead the other major indexes downward as well.
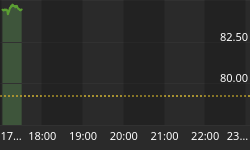
This week's Russell-2000 ETF (Amex:IWM) Daily Chart is below:

The chart for the IWMs shows that the Russell 2000 is more bullish than the other major indexes, as price sits above all the moving averages we regularly feature. It has a way to go to test upward to the short term trend line which would also likely lead to a test of the recent high. A break out here would suggest a bullish move. On the other hand, a downward move here closing below the 100-day moving average would see further downside action accelerate. We believe that there may be a short term move upward, but further downside is likely in the near future following this move.
Finally, let's take a look at the Advance decline lines for last week.

Examining the charts we note that the absolute value of advancers or decliners has been contained since last week's Wednesday's display of irrational exuberance over a possible Fed rate cut. We note that both 5-day moving averages have moved turned back upward, while the 8-day moving average is still moving downward. We would not be surprised if the market consolidated until the moving averages were back toward the top of their "normal" ranges for another run at some more significant downside action. At the same time, we could see a strong move up to challenge resistance.
Conclusion:
As indicated last week, we have seen a rise in food and energy costs, which are outside of the core rate. With the core rate at a high level, the Fed simply can not lower rates, even if the economy were to weaken further. Friday's Chicago PMI report suggests there are pockets of the economy doing better than expected, so we may actually get the opposite of what the bulls have been forecasting. We may see a strengthening economy in the face of rising inflation. This would force the Fed to raise rates (the bulls want them to lower rates) which would be looked on adversely by the market. However, we are certain the bulls would redefine their reasons for being bullish, once again, as a pick up in the economy will help companies to increase revenues. The question remains whether inflation will reduce consumer spending and company profits sufficiently to warrant a market sell-off.
The markets have corrected a bit from their overly optimistic assessment of a Fed rate cut in the immediate future. They have some work to do to try to break through resistance, or to see another round of selling. We are expecting some consolidation in the immediate future before a larger move. In the short term, this consolidation may be upward toward the short term downtrend lines.
Stay tuned for more.
Regards and Good Trading,


