


LET'S LOOK AT THE WEEKLY CHART OF THE 1946 DOWN JONES AGAIN

Please understand there is nothing new in these markets, everything is simply a repeat of the past.
For some time I have been saying the "pattern of trending" from 1946 would be a good roadmap for the current market and two weeks ago I put up this chart and indicated the pattern of trending continued to be exact. Last week I indicated the two specific patterns that needed to occur to make this forecast wrong and neither of those occurred. The decline in 1946 was 15 trading days and the next advance was 90 calendar days to complete the bull campaign.
NOW LET'S LOOK AT OUR CURRENT MARKET USING THE S&P 500

The 1946 decline was 15 trading days and the current decline was 14 trading days. The percentage decline the 1946 was greater at 11% versus the current 6%. That might give this circumstance a larger advance above the previous high. If it replicates 1946 the high price will be 1491 or if it extends that price due to the smaller correction it will go to the price of 1521. The odds still favor a 90 calendar day run from this last low and put the market up into June 12th although the last 45 days of that run will be a sideways distribution. The only thing that could get in the way of that forecast is the date around April 12th but for now I still have a lot of confidence in this forecast.
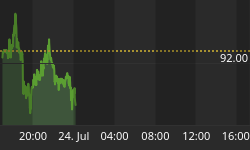
LET'S LOOK AT THE FTSE 100 INDEX

Last week we looked at how fast move start from False Break patterns or breaking to new lows and recovering. Also I noted that the direction of the trend determines the significance of the pattern. So double bottoms in downtrends are meaningless but double bottoms in uptrends can be powerful patterns. So if this uptrend is intact the move up should have been strong and it has been. Since the high was a function of a 144 calendar day cycle, 180 days or the first few days this week should bring in a countertrend down. It looks like there should be a new high to 6556** or even 6661 and then this trend is at risk of completing.


