


Market Wrap
Week Ending 4/13/07
Economy
The Reuters/University of Michigan's preliminary index of sentiment declined to an eight-month low of 85.3 in April from 88.4 a month earlier.
Producer prices increased 1% in March. The core rate remained unchanged. The U.S. Trade deficit narrowed to 0.7% in February.
Producer Prices were up 3.2% year over year. March Import Prices were up 2.8% year over year. March's Fiscal Deficit jumped 12.9% to $96.27 billion.
The G7 meet this weekend to determine the course of world affairs. Let's hope they get it right, as it is quite a bit of responsibility to lay on a group of just seven men, but alas that's how it's done. They are sort of a counsel of Elders, if you will. And who is El?
China's Foreign Ministry confirmed that the nation's top officials from the People's Bank of China and the Ministry of Finance will not attend the G7 meeting in Washington.
China is one nation not overly thrilled or impressed by the elite get together, as China's Foreign Ministry official said that:
"As far as I know, the finance ministry and central bank have full schedules for their principal officials lately so they are not able to attend that meeting."
Perhaps they are dismayed by the President's recent negative report on China to the World Trade Organization. It is a thing of beauty to watch diplomats at work.

International Monetary and Financial Committee
The Fed released the minutes from their last meeting, which contained the following:
"The combination of generally weaker-than-expected economic indicators and uncomfortably high readings on inflation suggested increased downside risks to economic growth and greater uncertainty that the expected gradual decline in core inflation would materialize."
"Further policy firming might prove necessary to foster lower inflation," the Fed added.
The minutes went on to say, "But in light of the increased uncertainty about the outlook for both growth and inflation, the committee also agreed that the statement should no longer cite only the possibility of further firming."
Federal Reserve Bank of Dallas President Richard Fisher had some interesting comments in a statement he issued last week:
"Globalization raises the economy's speed limit, allowing policy makers to relax and let the economy expand at rates that might once have been considered unsustainable. Getting more output from existing labor and capital allows the economy to grow faster without igniting price pressures. In a globalized world, faster growth need not carry the same inflationary implications it does in a closed world."
I have no idea as to why, but it struck me as odd that the word debt was never used in either statement; after all it is the largest growing sector of the world economy.
You would think it would get a little mention out of respect alone, but perhaps respect is absence in the abode of greed. I mean where is all the money coming from to pay for all this stuff? Maybe now it is different - maybe now you don't have to pay for stuff.
Politics
The following four items seemed worthy of mentioning. All are concerned with the war in Iraq. As the picture below shows, there are a few less than enthusiastic supporters of the U.S. occupation of Iraqi.
Democratic Senator James Webb accused Republican John McCain of questioning the patriotism of those who disagree with him on Iraq and ``hiding behind the troops as political justification' for a misguided policy. I know that I wasn't too thrilled with his endorsement of the Military Commission Act of 2006 that threw habeas corpus out the window.
Administration officials will advise President George W. Bush to veto legislation requiring him to provide lawmakers with details of the CIA's secret prisons for terrorism suspects, a White House statement said. This too was in the above sited Act of 2006.

Followers of radical anti-US cleric Muqtada al-Sadr march through
the holy city of Najaf, Iraq, Monday, April 9, 2007, on the fourth anniversary
of the fall of Baghdad to the US forces.
Congressional Democratic leaders agreed to meet with President George W. Bush next week to discuss their differences over an emergency spending measure to fund the war in Iraq that sets a timetable for troop withdrawals.
Defense Secretary Robert Gates said U.S. Army units would be deployed to Iraq for 15 months instead of 12 months, effective immediately.

Subprime Land
So, it appears that the real estate mini-crises via subprime loans has receded from crashing down on most shores. But appearances can be deceiving.
For instance, General Electric recently increased reserves at its U.S. subprime mortgage lending unit. They also cut jobs and reduced loan origination in the U.S. by about two-thirds.
Also worth noting is that more than 40 subprime lenders have either stopped all business operations, or have gone bankrupt since the beginning of 2006. The Mortgage Bankers Association reports that subprime mortgages surged to four-year highs in the final quarter of last year, which means there still is plenty of toxic waste floating around looking for a short to wash up on.
As reported in Bloomberg concerning a lawsuit that has been filed against some of the large banking houses:
Miller, the creditors' trustee, said "the banks knew or should have known that the investors wouldn't be paid back and that a fraud was being committed. These guys control the market,' said Miller. "They may say their only responsibility is to their shareholders but they also have a responsibility to the public."
The Wall Street firms ``knowingly participated in the wrongdoing because they profited substantially, while they were not at risk on any monies loaned' to American Business, Miller said in the complaint."
Let's take a look at a couple of charts and see what they have to say about the situation.
The first is the XLF or The Financial Sector, the largest sector in the S&P 500. Any strength or weakness in this sector affects the overall market with its trickle down affect.
The second chart is the REITs or Real Estate Investment Trusts, which is a good proxy that indicates the strength or weakness in the real estate market.
Both charts look almost identical, and they are not showing the healthiest price action possible. They appear to be breaking down quite substantially.

Note the resemblance in the two charts. They had been on a tear and then ....

Stocks
Since the downdraft of several weeks ago, U.S. stock indexes have been holding their own. It would appear that the worries of a bear market were overblown. It appears that the worries of subprime loans were overblown. It appears that worries of carry trades were overblown. Is the operative word overblown - or appears?
The Dow was up 0.4% for the week, as the S&P 500 added 0.6%. The Transports gained a very respectable 2.4%. The Utilities lost 0.2%.
The chart below of the transports show the index is bumping up into overhead resistance. It has yet to be decided which way it will go. Notice the volume at the bottom of the chart.

Cargo Ship

Up next is a chart of the NASDAQ, the index that propelled the bull market on towards heights never before reached. Notice the similarity with its price structure and those of the financials and reits earlier on.

As can be seen, the NASDAQ has yet to regain all that it lost during the world stock market debacle that began in China.
And how is China's market doing - the chart below shows it has gone on to higher levels - setting more records.
China's Shanghai Composite index roared ahead 5.9% to a record high, increasing 2007 gains to 31.5%.
This was the shot supposedly heard round the world when it fell 9% in one day several weeks ago, which lead to the precipitous fall of most world stock markets. Most of the other markets have not regained their losses, but the Shanghai has not only regained them - it has made NEW HIGHS.

[Chart courtesy of Bloomberg L.P.]
We remain unconvinced by any of the above. Why? The chart below shows why. It compares the Dow Industrials with gold.
Gold has so far out performed the stock market it is not even close. And selected gold and silver stocks have done even better.

Bonds
Two-year government yields were up 4 bps to 4.76%. Five-year yields added 3 bps to 4.68%. 10-year Treasury yields were up 2 bps to 4.76%. Long-bond yields added one basis point to 4.93%.
Last week the slope of the yield curve continued to lessen but still remained positive. This week the spread between the 2 year yield and the 10 year yield closed the week at zero. Just a month ago we had an inverted yield curve. How things change.
Rates were up across the board this week but shorter term rates were up more then longer term, hence the yield curve spread fell to zero. The playing field was leveled.
Those familiar with this report will recall that we have always said that the Fed wanted its coveted inverted yield curve (saying so before they ever attained it), which they did get.
We also said that getting it and holding on to it might be two different animals, which appears to be the case. So far things are going pretty well, and they have none a clever job of "adjusting" rates.
As with the stock market - we remain skeptics. Any surprises in interest rates will be to the upside - not to the downside. Already faint murmurs are beginning to be sounded.
One of many similar news headlines this past week ran:
U.S. Treasuries fell, pushing yields on 10 year securities to the highest level in almost two months, speculating that inflation will increase, while the dollar declines.
Notice the headline speculates that interest rates are going up, causing bonds to go down - yet the dollar declines as well. Aren't higher interest rates good for a currency? Doesn't this sound like bonds and the dollar can go down together - at the same time?
Once again, those familiar with our reports know that we have many times stated that a time would come when interest rates moved higher - and considerably higher - yet it would not have a supportive affect on the dollar. The dollar would still go down.
Is this the time? No, we do not think so in the very immediate future or short term time frame. But yes - the time is fast approaching. Dust clouds can be seen on the horizon.
First up below is the chart of the 10 year treasury yield, followed by the chart of the 30 year Treasury bond yield. They both indicate that rates have begun to back up. Important resistance levels are indicated. If those levels are breached - it ain't gonna be pretty.

Fed Foreign Holdings of Treasury Debt gained a large $18.7 billion last week to a record $1.91 trillion. Custodial holdings were up $319 billion during the past year.

Oil
Crude oil prices fell slightly for the week because of surging inventories in Cushing, Oklahoma, where West Texas Intermediate oil is delivered.
Natural gas prices fell supposedly due to adequate inventories to meet present demand. Gasoline was up 1.9% and Natural Gas 2.0%.
The chart below shows the devastating fall that crude oil has taken. It also shows the recent rally and that a significant resistance level has been broken through. If the resistance level holds as support - oil may be changing direction.
It has a rough long hill in front of it - but it has overcome such before. Be it noted that rising oil prices may be good for those traders long oil, however, for the average consumer rising oil prices are not good.

Oil Rig at Sea

The Energy Select Sector and the American Exchange Oil Index have both been performing even better than crude oil.
Notice how both charts are almost mirror images of one another. They both have just broken through significant resistance levels, which now need to hold as support.
RSI levels are approaching overbought. A short term consolidation may be pending. If crude rises they will keep rising. If crude falls - that may give them the impetus to consolidate and digest their recent gains.

Nuclear Reactor


Next up is the chart of Suncor Energy, the leader in all things Athabasca - or the oil sand fields in Alberta, Canada. The bituminous containing sands hold oil that can be extracted from them.
Suncor is the leader of the pack in this method of oil production. It has been on a tear as of late. This past week it broke above significant resistance as the chart below shows.
We did own it but sold into the end of this week's highs to book profits. A short term consolidation would be of no surprise after such gains. RSI is entering overbought territory.

There have been rumors and talk that Russia wants to form a cartel of gas exporting nations similar to the structure of OPEC.
The picture below shows that it is much more then idol rumor and that serious discussions and meetings are taking place.

Russia's Minister of Industry and Energy Victor Khristenko (2nd L)
arrives for the opening of the Gas Exporting Countries Forum in Doha April 9, 2007.
Commodities
The CRB index added 0.1% this week and is up 3.5% so far this year. Some analysts bemoan the price action of the commodities - pointing to the chart of the CRB Index as evidence that the commodities have broken down.
The CRB Index is a weighted index that gives certain commodities a much larger affect on the price structure, especially the energy sector. This can skew the index as to the true performance of commodities in general.
There are many commodities, on some days some are up, while others are down. The comparison of the CRB Index with the CCI Index, which is not a weighted index, shows the vast difference between the two, and the real state of the commodity markets.
Corn prices rose as farmers continued to face delays in crop seeding due to heavy rain and snow that made fields soggy and unworkable in the mid-west. Soybean futures declined.
Copper prices kept on chugging ahead on speculation mine disruptions may limit output amid rising metal consumption in Asia. Copper was up a significant 4.8%. Wheat prices jumped more than 3% after freezing temperatures hurt the hard red-crop variety in the Southern Great Plains.

Notice the huge difference between these two indexes. The CCI shows the real performance of the overall commodity markets.

The chart below shows the performance of copper. It has had a nice rally up, however; it still has a ways to go to turn the long term trend back positive.

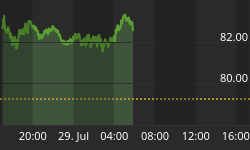
U.S. Dollar
The dollar index lost 1% closing the week at 81.92. The Canadian dollar gained 1.2%, and the Euro was up 1.2%. The South African rand lost 0.9%.
The chart below shows the dollar to have just broken below significant support - if the broken support now becomes resistance it will not be good for the dollar.
If the two lower lows that are marked on the chart are broken - things will not be well in paper fiat land.
Following the dollar chart is a chart of the euro. Overlaid on the euro chart is the price action of gold. Since the fall of 2006 the price of gold and the euro have tracked one another quite closely.
What does it mean? - just what it says - since the fall of 2006 gold and the euro have tracked one another quite closely - nothing more, nothing less. Will it continue? I dunno.


Next up is a chart of the Australian Dollar Index. It has just broken above important resistance. Why is the Australian dollar rallying? - because commodities have been rallying. That and a little help from interest rate differentials.

Gold & Silver
The first chart up is the Hui Index with the price action of physical gold overlaid on top of it. As can be seen the two follow one another fairly closely.
There have been times in the past where the two have not traveled in the same direction, or at least in the same time frame; and there will be times in the future when they do not track one another.

Next is the chart of the Hui compared to Gold. The chart shows that since March the trend has been up and in favor of the gold stocks over the physical metal. This is viewed as a constructive indicator for the overall precious metals complex.

Next is the Hui Index by itself. The chart shows that horizontal resistance at around 360 has been broken above, with the index closing at 364.47. This is a very positive occurrence, especially if the break holds.
As of now we are not calling it a break out - but a break. We want to see the follow through with a two day close above this level, and prefer a weekly close above as well.
When this level acts as support, as opposed to resistance, we will be convinced and undaunted, and will act accordingly. Until then we wait and watch.
We also note that the gold stocks have been up for eight days running - a bit long in the tooth as they say.
We hold large positions in the gold and silver stocks and will be happy if they go up from here. If they go down - we will use the cash raised in taking earlier profits to re-deploy at lower prices.
We still retain a large chunk that has not as of yet been committed to the precious metals market.
Either way we are satisfied. The best is yet to come. Patience and fortitude will be rewarded accordingly.

Below is daily chart of silver. Silver has not been as strong as gold lately. The chart shows that silver has not yet broken above its overhead resistance line.

Next up is a monthly chart of gold. The chart shows the very nice bull run, as the chart goes from the bottom left hand corner to the top right hand corner. However, there are some indicators to be concerned with.
RSI has been overbought for about a year now. MACD is flat and could be headed for a negative cross over - that is the main concern. The stochastic reading shows a negative divergence as well. Caution is warranted.
Following the monthly chart of gold is the weekly chart, which paints a bit of a different picture. The weekly chart shows that all major corrections have started from RSI readings of 70+. As the chart shows, we are not even close. Also note the 65 week moving average that has worked like a charm for timing buys.


Below is the weekly chart of the Hui Index. As the weekly chart of gold showed, all significant corrections have come with RSI readings of 70+. We are not yet close.
Notice how the corrections all line up with the elevated MACD readings as well. The 65 week moving average - once again - works like a charm.

Next is the monthly chart of the Hui Index. It shows a negative MACD cross over has already taken place - which needs to be resolved to the upside - soon. Histograms have turned negative.
However, the monthly charts develop from out of the weekly, and the weekly develop out of the daily. But this is an ongoing cycle of cycles with many variables that do not always work out the same each time. There are overlaps and intersections - divergences and convergences.
We cautiously watch the daily and weekly charts to see how they develop from here. Is the monthly giving a sage warning or will it correct to the upside? If it does, it will be in very over bought territory.

Individual PM Stocks
Kinross Gold
First up is Kinross Gold (KGC). We have owned this stock many times during the gold bull market and it has been very good to us, but we do not presently own it (see the gold stock portfolio). We consider it to be one of the top shelf gold stocks and are watching it closely to accumulate a new position on any corrective action.
It's possible that it is forming the handle of a cup and handle formation, which means it will consolidate in the range seen to the right of the chart (yellow shade area - the handle) and will not correct below that level. On balance volume has been strong as well.

Eldorado Gold
Next is Eldorado Gold (EGO). We have also owned this stock many times but do not own any as of now (see the gold stock portfolio).
It has recently broken above its upper downward sloping trend line as the chart shows.
Now it is bumping up against horizontal resistance marked on the chart by the blue horizontal line and noted by the blue arrow.
We are watching for a good entry point to accumulate a new position. A pull back that holds above the upper trend line should represent a good buying opportunity.
If the horizontal resistance line is broken above - a pull back that tests that level would be another opportunity. Or one can buy the breakout if it occurs.

Northgate Minerals
We presently own a substantial position in Northgate Minerals (NXG). It has also broken above its upper falling trend line and is now bumping up against horizontal resistance, which it has managed to poke its head just above.
A positive MACD cross over has just recently occurred and the histograms are turning positive. Northgate could be setting up for a good move.

Summary
So far the world stock markets have held together after the "China" fall. It is fascinating that China's Market (where the domino-like fall began) has not only held together, but has gone on to substantial new all time record highs.
In our opinion it is an asset bubble waiting for a time and place to pop. Will it go higher? It very well may. If it does, it will do so without us aboard. And we will have NO regrets.
The subprime loan problem appears to have quieted down for the moment. There are still huge amounts of these loans out there. If interest rates go up they may trigger more defaults due to adjustable rate mortgages.
Also, many of the loans have not yet adjusted to the present rise in rates, as they are still in their initial lower "teaser zone rates". Once the "honeymoon" is over and they adjust upwards there could be more problems as well.
Bond yields are no longer inverted. For a few weeks there was a positive slope to the yield curve. Now the yield curve is flat. Any surprises in rates will, in our opinion, be to the upside.
Although interest rates have gone up - the dollar has continued to go down. Generally rising interest rates are positive for a currency. So far such has not been the case for the dollar. The chart does, however, show some positive divergences. Long term the dollar is burnt toast, which gold has picked up the scent of long ago.
Commodities when viewed through the correct perspective (CCI non-weighted index) shows that things that hurt when you drop them on your toes have been a good sector to be invested in. Perhaps it is because they are REAL things - stuff. The realist of the real is gold - the asset that is no one's obligation.
The gold stocks have broken above horizontal resistance. We are not yet calling it a break out, which it very well may be. We are waiting for at least a two day close above the break and preferably a weekly close. An even stronger indicator will be when previous resistance holds as support.
We do note, however, that this level has been under attack for some time now and repelled on a few different occasions. Such does not represent weakness but strength.
Every new assault wears away more and more of the overhead resistance or supply. Stocks leave weak hands and enter strong hands. When the break out finally occurs it should be quite strong once it gets going.
However, there are the monthly charts of both Gold and the Hui that indicate caution is warranted. The monthly charts do come out of the weekly, which in turn come out of the daily. This favors that the monthly charts will be resolved by the weekly and daily price action; which yet remains to be seen how it develops from here.
There is, however, no guarantee that this will occur, and even if it does the monthly chart will be very overbought. The signals are mixed. Guarded optimism seems prudent. Forewarned is forearmed - even if never needed or used.
The G7 are meeting this weekend - planning the course of the world. Hopefully they will make some good decisions. The picture below sums it up quite well.

See the market indicator table below and the gold stock portfolio, as there were a number of changes this past week.
Invitation
Stop by our website and check out the complete market wrap, which covers most major markets. There is also a lot of information on gold and silver, not only from an investment point of view, but also from its position as being the mandated monetary system of our Constitution - Silver and Gold Coins as in Honest Weights and Measures.
There is also a live bulletin board where you can discuss the markets with people from around the world and many other resources too numerous to list. Drop by and check it out. Good luck. Good trading. Good health. And that's a wrap.


