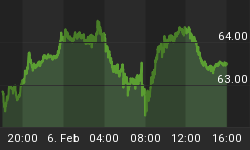
FIRST LET'S LOOK AT A DAILY CHART IN US T-BONDS

Last week I said bonds were about to fall off a cliff and ruin the party in stocks. You can see yesterday was a panic move down. The first objective for this move is the May/July lows and bonds will likely struggle down into that level after this thrust down. A wide daily range, after being down over 180 calendar days is a process of putting in a low and a temporary exhaustion. The bounce off the next low at the obvious support will take a good deal of time, maybe weeks but could be a month but the trend in price is down.
NOW LET'S LOOK AT THE MONTHLY CHART

You can see the 1997/1998 decline and there is no reason why the number of points lost then will not be duplicated in this move down. But it will take some time. How the index rebounds up from this “obvious” support will be the key to how long it is going to take to get the long bond down to 95-but it's going there. I'll lay out those parameters when the index starts the next rally in a week or two.
NOW LET'S LOOK AT A FEW OF THE STOCK INDEXES-FIRST THE DAX

I have been saying this rally would be the last leg up to this trend and would be the fastest of the entire bull campaign as it would exhaust into a high. The previous high exhausted and distributed below the high for six months before trending down. I wouldn't expect a repeat of a bear campaign of that magnitude now that style of distribution. The index should go to the price of the February highs and bounce creating a secondary high or lower high then run down to break the March 2003 high for a low. If this decline can find a solid low above a decline of 700 points and less than 13 trading days, then it could holds its trend. But I doubt that could occur. So I am looking for a lower high as the distribution pattern.
NOW THE FTSE 100 INDEX DAILY CHART

The last move up in this index did not exhaust but showed what I have defined as a weak three thrust pattern and represents distribution. That would make this index vulnerable to a move down to the April 2006 high for this leg.
LET'S TAKE A QUICK LOOK AT THE S&P INDEX

This also had a three thrust pattern and it is unusual not to exhaust this index. But rather than show another leg there maybe a large distribution pattern develop. The previous correction was 97 points and should be broken on this leg. But once this stabilizes there could be a significant rally into the end of July. The index showed a volume spike and wide daily range that closed on the low so a counter trend of a few days is getting close but it looks like it must test the February high which is also ¼ of the range of the last two legs up is reasonable. But we will see a distribution pattern of some sort.
The markets are telling us Inflation is here.


