


It is now Noon time, so we will do an update on how the NYBR did in predicting a reversal after the open this morning. (This morning's posting is below this Noon Time update).
Noon Time Update ...
This morning we showed how an NYBR divergence should have reversed the market back up after the open. If you have followed real time charts this morning, that is what has happened as of Noon today.
Below is the Noon time NYBR chart on a 60 minute basis. Looking at it, it is hard to tell that it has made 3 significant ticks up ... see the next chart.

When we look at the NYBR's 1 minute chart, it becomes evident how it consistently rose up higher after the open this morning. This meant that the amount of negative stocks on the NYA Exchange continued to improve from over -1300 stocks to - 5. That meant that 1295+ stocks moved to the positive.

How did that affect the markets?
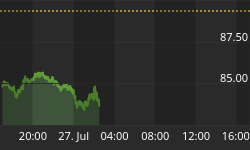
The SPY's chart is below, and you can see how it has steadily gone up since the open.

This is the QQQQ's chart and it has moved steadily up since the open.

What will happen the rest of the day?
If you can't bring up the $NYBR on the charting service you use, then try using the TICK on a 1 minute chart with smoothed moving averages of 30, 70, and 150 minutes.
Follow such a TICK chart and watch the trend lines on the moving averages. You can see the current reading as of Noon time.
As long as the trend holds to the upside, this morning's rally will hold. If you see it trend to the downside, then today's rally will be in jeopardy and could reverse.

Posted at the Open this morning ...
The VIX has moved up above 17 at the close yesterday showing a large amount of fear creeping into the markets.
At the same time, there is outside support for the market in terms of Liquidity inflows coming from the Fed? and Foreign sources. It was noticeable yesterday afternoon when the VIX made a run up higher and liquidity inflows came in at the same time. The result was that yesterday's S&P drop on an equivalent VIX move was less than half of what it should have been.
Below is a chart of the SPY and the New York Stock Exchange's Breadth ... symbol: NYBR. The NYBR is an advance/decline measure of the number of stocks moving up vs. down on the New York Stock Exchange ... which is also where most of all the program trading occurs.
Note the action of the SPY against the NYBR at the end of the day yesterday. The SPY was down, and the NYBR was a negative 5 ... but the 60 minute NYBR was showing divergence to the upside.
Ten days ago, it was showing the same kind of divergence and the SPY reversed up. What that says, is that even though the market opened down at the open, that there is a good probability that it will reverse back up after things settle in mid morning. Come back around Noon Time and we will see if this divergence reversed the market back up with a new updated chart at that time.


