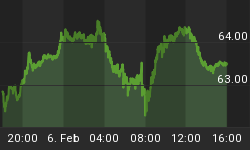
FIRST LET'S LOOK AT US T-BONDS

My forecast says the trend is down and will eventually go to 95 before this downtrend is complete. I've indicated the risk of resuming the downtrend will come after the completion of three thrusts upward in an overall weak rally upward. Because the last multi day move down retraced deeply into the move up I can qualify this as a weak move up. There are now two drives and a new high above the high set last week will then put the move up at risk and possibly resume the downtrend in bonds and the fear of a rise in interest rates. There needs to be some evidence of a failure once at the new high.
NOW LET'S LOOK AT STOCKS USING THE S&P 500 DAILY CHART

My forecast was for the index to rally up 3 or 4 days from the "obvious support" and run down to marginally break the February high. The rally has been 7 days and not the 3 or 4 days I was looking to occur but my forecast of moving into a lower or secondary high on July 27th is looking less likely unless this move down can quickly move down to break that "obvious" support at the last low and move down to the February high. This needs to occur within the next 6 trading days because a secondary high would need a rally of a minimum 7 trading days. A move of that magnitude down would be unusual at this stage. But from the time cycles I use this is still possible, although I am not as confident as I was a few weeks ago.
I still have a lot of confidence in the dates of July 27 or August 5th for an important cycle expiration in the FTSE.
LET'S TAKE A LOOK AT THE NASDAQ 100

How the NASDAQ performs the next week may give the clue for the entire index. You can see how the index struggled upward for May and June then resolved that struggle with this fast trend up. This is a recognizable pattern of trending and is always resolved with an exhaustion trend that ends the trend. During an exhaustion trend the index should not correct more than 3 or 4 days or the trend will be complete. The 100 should stay out of the congestion it just broke away from or it will indicate a possible completion. Seeing the more speculative NASDAQ diverge from the S&P 500 could be indicating a little burst of speculation prior to a more serious move down in the averages. I've laid out the criteria for this index to hold this fast trend and if it doesn't meet that criteria it could have ramifications for all the stock indexes.


