


They say history doesn't repeat it merely rhymes. If that's the case, we may be setting up for a 2007 market crash. Take a look at this 1987 stock market crash picture:

Chart 1 - 1987 stock market crash picture
Since the early 80s the stock and bond markets had been motoring along nicely. Bonds made a high in early 1986 and had been building a top formation into 1987 (not shown). Then in early 1987 Bonds moved lower out of their top formation. The weakness continued until early May when all told the Bond market received a 15% haircut.
The stock market however wasn't phased. It was quite content to plough ahead even in the face of a deteriorating bond market. In fact, once bonds made a short term bottom in May the stock market celebrated and rallied to fresh highs.
The summer of 1986 saw bonds and stocks rally together -- until July. Bonds began declining again (I'm sure the expectation was a double bottom as the stock market continued to surge).
Then came Fall (excuse the pun). Bonds broke below their May lows in September and the market finally sat up and noticed. From then on out it was Katy Bar the Door - the stock market proceeded to tumble into what culminated as the largest 1 day decline in history - Black Monday 19th of October 1987.
Fast forward to today:

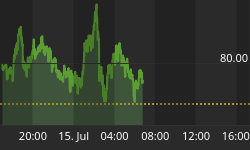
Chart 2 - 2007 market crash?
Bonds made a high at 115 in late 2006 and have been trending lower ever since. The stock market likewise has been unfazed (except for a brief hiccup in March) and has been boldly moving higher.
We are now entering an especially interesting phase in relation to 1987. Bonds began their latest leg down in earnest in March at which time the stock market surged higher -- eerily similar to 1987. Now, Bonds have been staging a moderate bounce since June and if the 1987 picture is to unfold again, the minor rebound would be close to over.
If bonds turn lower (as they very well could because of the weak Dollar) I would take that as the first sign of caution. If bonds break below their June lows I would take it as a MASSIVE warning.
Not co-incidentally, gold stock prices are beginning to come alive!
More commentary and stock picks follow for subscribers...


