


When I was a kid I loved to experiment with stuff, and cooking was one of them. I thought that if I cooked spaghetti in a pressure cooker it would get it cooked faster, and impress mom and dad. Well I cooked it, my father and I opened it and we were soon pulling spaghetti off the ceiling. The moral of the story is to understand the parameters of the task, dangers etc before proceeding. My grandmother told me never to cook spaghetti in a pressure cooker, but I chose not to listen, and I as a consequence we had spaghetti mixed in with stipple-tone. The FED is doing something similar to the economy right now. History is an important and often neglected as a newer generation feel nah…….that is old stuff it does not apply here. Massive surges in liquidity in the past have lead to deflation, or hyperinflation followed by deflation. The latter is the worst scenario, because all paper assets, pension funds etc become worthless, with the end of the cycle bringing a crash in physical assets. The road that the economy takes is uncertain, but the FED keeping everything in a pressure cooker environment is bound to have the lid blow off spilling all of its contents on to other economies.
This issue includes the XNG or the Natural Gas Index. The XOI recently has turned bullish, while the XNG has been bullish for nearly one year now. Refer to text within each chart for a further description of what is being observed. The charts for each indice has and Elliott Wave count and a stochastics chart. For anyone wishing to further study Elliott Wave I cannot stress the importance of reading "Mastering Elliott Wave" by Glenn Neely. This is a stand alone text book jam packed with information.
Volatility Index
The volatility index has finally had the %K and %K lines cross. This is indicative of an increase in fear in the coming months. No one knows how the pattern will unfold, just that it will be rising. No Elliott Wave counts can be applied to the VIX, as it oscillates between a given range.

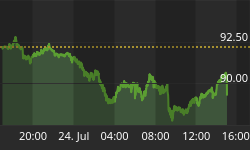
US Dollar Index
The US dollar index has finally completed its sideways corrective pattern and is heading down to 85-90. The stochastics back up the Elliott wave count.


S&P 500 Index
The Elliott wave count from last week was out of phase , with the wave pattern completing this week as a failed fifth. This implies the S&P will drop to 910-920 prior to moving up in one final leg before the larger degree leg down initiates. The stochastics chart is nearing a cross-over. A lot of pulling and tugging between long and short positions could whipsaw the wave pattern around for awhile, but the overall trend is lower. A bottom of 600-650 is expected later this year to early next year.


HUI Index
The stochastics chart clearly shows the HUI has significantly more upside potential in the longer term for this rally. The wave structure suggests a drop to 130-135 before the powerful move up. The charts have a lot of information regarding future wave structure.


XOI Index
The Hullbert curve is projecting for oil production to peak globally in 2004. This will spell significantly higher oil prices. Refer to the prior issue to see the longer term XOI count. A corrective pattern from 1998 till present completed recently. Whenever a commodity is in a short supply, the prices will rise, irrelevant of inflation or deflation. The Elliott wave pattern has a preferred and alternate count that share a similar weighting, so keeping a close eye on how things unfold is crucial to those trading oil stocks.


XNG Index
The XNG index is a basket of natural gas stocks. The Elliott wave pattern indicates a bull market has been underway since July 2002 with a very stretched stochastic pattern. The current move up has gone somewhat parabolic, so a pullback can be expected soon.


Summary
Elliott wave analysis offers a quantification of a wave pattern with predictive power as to what type of correction may develop, height of bull markets, percent retracements etc. The stochastic settings for each different index offer an increase in accuracy when coupled to Elliott wave analysis by inferring if a market is bullish, and the projected time for completion. Other indicators can be used, this is just my own personal preference for the time being. Commodities over the next decade and further will be the investments of choice. Currently there is discuassion the FED will cut interest rates by half a percentage point. This is killing those invested in money market funds right now. Longer term bonds can expect more capital flowing in this direction, making the bond bubble even larger than it currently is. If a spike in interest rates were to occur, the value of the bonds would decrease significantly. With problems being mentions with Freddie Mac and Fannie May, it just goes to show there are many more cockroaches in the woodwork that will find the light of day.


