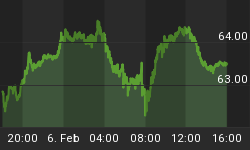
Purely from a technical pattern, the XLF Financial Select SPDR, a sector that everybody is watching, appears to have completed a pullback in the aftermath of last week's powerful advance from 31.50 to 36.50.
Today's low at 33.58, followed by the upside pivot and rally to 34.15/30 has the right look of the start of a near-term advance that should revisit 35.50 at a minimum and more than likely 36.50 in the upcoming hours.
This is a sector the Fed has a vested interest in support via its various liquidity tools, as the alternative definitely is unpalatable.

Liquidity tools obviously have a bearing on yields, and there is a fascinating situation developing in the 10-year T-note Yield which shows why I want to be long the iShares Lehman 20+ Year Treasury Bond (TLT) despite the fact that the urgency of the recent flight to safety "trade" may appear to be behind us.
The yield structure, after having failed to sustain above a 6-year resistance line at 5.22% in mid-June, reversed with power and now is pressing against its 4-year support line at 4.60%! Although the intermediate-term support line was breached last week, thus far 4.60% has contained the pressure on yield for now.
However, my pattern and oscillator work is "warming" to expect the 4-year trendline to break and for 10-year yield to continue to lower into the 4.25 area next.
Why? More bad news in the credit markets perhaps, and/or another nosedive in equity prices certainly could trigger a secondary flight to safety that will impact yield positively. Perhaps weak economic data due out during the next few weeks ahead of the next FOMC meeting (9/18) and a possible rate cut also could trigger a "preemptive" decline in the 10-year yield.
In any case my work is warning me to be long the TLT in anticipation of continued pressure on 10-year yield.


