


The good news is:
• Money supply as measured by M2 has been increasing sharply.
Short Term
I had to go back over 4 years to find a time as volatile as the current period.
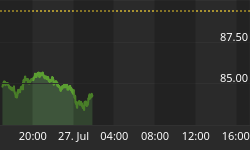
The chart below covers the past year showing the NASDAQ composite (OTC) in blue and an indicator plotting the absolute value of the daily percentage change of the OTC over the past 10 trading days in orange. Dashed vertical lines have been drawn on the 1st trading day of each month.
Volatility hit its high for the year of 1.4% on August 9 and is currently at 1.2%.

For a longer term perspective, the chart below is similar to the one above except it covers the past 10 years. Dashed vertical red lines have been drawn on the 1st trading day of each year.

Volatility increases during bear markets.
The all time high in volatility was 5.6% set in early 2001.
Intermediate Term
The 3rd year of the Presidential Cycle is the strongest of the 4 and, since 1939, the first 9 months of the 3rd year of the Presidential cycle have never been down. Although up, this year ranks as the worst since 1947.
The table below shows the performance, in percentage, for the 1st 9 months of the 3rd year of the Presidential Cycle.
| 2007 | 2003 | 1999 | 1995 | 1991 | 1987 | 1983 | 1979 | |
DJIA | 7.18 | 12.88 | 17.95 | 20.24 | 15.57 | 40.45 | 16.21 | 10.26 |
SPX | 3.93 | 14.57 | 7.42 | 22.34 | 19.75 | 36.19 | 16.89 | 13.74 |
OTC | 7.50 | 35.56 | 24.93 | 35.66 | 40.62 | 30.43 | 25.82 | 27.51 |
R2K | 0.66 | 28.84 | 1.39 | 21.95 | 35.49 | 29.62 | 30.04 | 35.84 |
| 1975 | 1971 | 1967 | 1963 | 1959 | 1955 | 1951 | 1947 | |
DJIA | 35.55 | 7.05 | 14.71 | 11.84 | 13.84 | 16.03 | 14.80 | 0.93 |
SPX | 26.72 | 7.47 | 16.57 | 14.90 | 7.95 | 20.54 | 14.06 | 0.13 |
OTC | 32.08 | 21.28 | 43.98 | |||||
| 1943 | 1939 | 1935 | 1931 | 1927 | 1923 | 1919 | 1915 | |
DJIA | 14.42 | -13.15 | 22.92 | -15.29 | 20.73 | -5.34 | 27.43 | 48.77 |
SPX | 20.78 | -15.37 | 19.16 | -9.65 | ||||
The following two charts show the two years since 1939 where the major indices had a weak first 9 months during the 3rd year of the Presidential Cycle.
The first chart shows the Dow Jones Industrial Average (DJIA) and the S&P500 (SPX) on log scales. The DJIA and SPX were flat for the year at the beginning of September after a July high. They ended flat for the year.

The next chart shows the DJIA, SPX and NASDAQ composite in 1971.
In the first 9 months of 1971 the DJIA was up 7.05% compared to 7.18% this year.
There are similarities between 1971 and the current period. The indices were down sharply in late July, bottomed in early August and finished August up. September began with a strong rally to the high for the month (perhaps the same as this year).

The next chart shows the SPX and an indicator showing the percentage of the component issues of the SPX that are above their 50 day EMA’s. The chart covers the past 2 years, the SPX is shown in red and the indicator in olive drab, there are dashed horizontal lines drawn at the 25%, 50% and 75% levels for the indicator.
Usually when the indicator rises from below to above the 25% level it indicates a low that will hold for at least several months. In the past month the indicator has moved from below the 25% level to above the 50% level then back below the 25% level several times. It is currently at 30%.

My data for this indicator only goes back 10 years. During that time the only period I found with even remotely similar behavior was near the low of 2002.
The chart below is similar to the one above except is shows the period from May 2001 to May 2003.

Bottoms are often marked by sharp reversals while tops are usually time consuming affairs that evolve over weeks or months with the secondaries deteriorating while the blue chips go to new highs. From the low, the secondaries usually lead the way upward.
The chart below covers this year showing the DJIA, SPX and Russell 2000 (R2K) on log scales. Through the end of February the R2K was clearly the strongest index, by the July high it was the weakest. Unlike the other indices the R2K hit its low for the year in mid August.

The DJIA reached its all time high on July 19 and a recent low less than a month later on August 16 when the NYSE recorded the 3rd highest number of new lows ever at 1132. The extreme number of new lows at the mid August low along with the continued underperformance of the secondaries suggest this decline has further to go.
Seasonality
Next week includes the week prior to the 2nd Friday of September during the 3rd year of the Presidential Cycle.
The tables show the daily returns for the week during the 3rd year of the Presidential Cycle. OTC data covers the period from 1963 - 2003 and SPX data from 1955 - 2003. There are summaries for both the 3rd year of the Presidential Cycle and all years combined. Prior to 1953 the market traded 6 days a week so that data has been ignored.
The OTC has been up 64% of the time in the coming week with an average return of 0.6% helped measurably by the 3.92% return in 1995. The SPX has been on average flat and over all years and the average return has been negative.
Report for the week before the 2nd Friday of September
The number following the year is the position in the presidential cycle.
Daily returns from Monday to 2nd Friday.
| OTC Presidential Year 3 | ||||||
| Year | Mon | Tue | Wed | Thur | Fri | Totals |
| 1963-3 | -0.06-% | -0.17-% | 0.39-% | -0.06-% | -0.14-% | -0.03% |
| 1967-3 | 0.00-% | 0.51-% | 0.12-% | 0.30-% | 0.15-% | 1.08% |
| 1971-3 | 0.00-% | 0.50-% | 0.05-% | -0.03-% | -0.12-% | 0.40% |
| 1975-3 | -0.41-% | -1.11-% | -1.78-% | -0.52-% | -0.17-% | -3.99% |
| 1979-3 | 0.57-% | -0.35-% | 0.18-% | 0.45-% | 0.82-% | 1.67% |
| 1983-3 | 0.00-% | 1.13-% | -0.16-% | 0.34-% | 0.15-% | 1.47% |
| Avg | 0.08-% | 0.14-% | -0.32-% | 0.11-% | 0.16-% | 0.13% |
| 1987-3 | 0.00-% | -1.99-% | 0.36-% | 0.98-% | 0.61-% | -0.04% |
| 1991-3 | 0.22-% | -1.31-% | 0.68-% | 1.24-% | -0.85-% | -0.02% |
| 1995-3 | 0.00-% | 1.94-% | 0.48-% | 0.65-% | 0.85-% | 3.92% |
| 1999-3 | 0.00-% | -0.12-% | -1.10-% | 1.54-% | 1.23-% | 1.56% |
| 2003-3 | 1.63-% | -0.80-% | -2.00-% | 1.22-% | 0.48-% | 0.54% |
| Avg | 0.93-% | -0.46-% | -0.31-% | 1.13-% | 0.46-% | 1.19% |
| OTC summary for Presidential Year 3 1963-2003 | ||||||
| Avg | 0.39-% | -0.16-% | -0.25-% | 0.56-% | 0.27-% | 0.60% |
| Win-% | 60-% | 36-% | 64-% | 73-% | 64-% | 64% |
| OTC summary for all years 1963 - 2006 | ||||||
| Avg | -0.17-% | -0.07-% | -0.22-% | 0.11-% | 0.15-% | -0.10% |
| Win-% | 44-% | 50-% | 51-% | 61-% | 59-% | 60% |
| SPX Presidential Year 3 | ||||||
| Year | Mon | Tue | Wed | Thur | Fri | Totals |
| 1955-3 | 0.00-% | 0.60-% | -0.02-% | 0.07-% | 0.02-% | 0.66% |
| 1959-3 | 0.00-% | -1.43-% | -0.71-% | -0.52-% | 0.74-% | -1.93% |
| 1963-3 | -0.36-% | 0.56-% | 0.29-% | -0.07-% | 0.03-% | 0.45% |
| 1967-3 | 0.00-% | 0.57-% | 0.19-% | -0.06-% | 0.03-% | 0.73% |
| 1971-3 | 0.00-% | 0.46-% | 0.19-% | -0.53-% | -0.38-% | -0.27% |
| 1975-3 | 0.32-% | -1.50-% | -0.96-% | -0.41-% | -0.18-% | -2.73% |
| 1979-3 | 0.47-% | -0.61-% | 0.29-% | 0.03-% | 0.84-% | 1.02% |
| 1983-3 | 0.00-% | 1.75-% | 0.04-% | -0.11-% | -0.51-% | 1.17% |
| Avg | 0.39-% | 0.13-% | -0.05-% | -0.22-% | -0.04-% | -0.01% |
| 1987-3 | 0.00-% | -0.99-% | 0.11-% | 1.02-% | 1.53-% | 1.68% |
| 1991-3 | -0.14-% | -1.03-% | 0.14-% | 0.58-% | -0.97-% | -1.41% |
| 1995-3 | 0.00-% | 0.95-% | 0.18-% | 0.02-% | 0.42-% | 1.56% |
| 1999-3 | 0.00-% | -0.50-% | -0.47-% | 0.26-% | 0.30-% | -0.41% |
| 2003-3 | 1.00-% | -0.82-% | -1.20-% | 0.54-% | 0.22-% | -0.25% |
| Avg | 0.43-% | -0.48-% | -0.25-% | 0.49-% | 0.30-% | 0.23% |
| SPX summary for Presidential Year 3 1955 - 2003 | ||||||
| Avg | 0.26-% | -0.15-% | -0.15-% | 0.06-% | 0.16-% | 0.02% |
| Win-% | 60-% | 46-% | 62-% | 54-% | 69-% | 54% |
| SPX summary for all years 1953 - 2006 | ||||||
| Avg | -0.26-% | -0.05-% | -0.15-% | -0.15-% | 0.10-% | -0.36% |
| Win-% | 45-% | 52-% | 51-% | 44-% | 63-% | 50% |
Mutual Fund
Compliance issues demand that I not mention the mutual fund that I manage by name or symbol in this letter.
To see a current chart of the fund go to: http://finance.yahoo.com/q/bc?s=APHAX&t=6m&l=on&z=m&q=l&c=.
For information about the fund go to: http://www.thealphafunds.com/index.htm.
The fund now has service class shares available.
Conclusion
Seasonally, the strongest part of September is over and most indications are we are in the down part of the cycle.
I expect the major indices to be lower on Friday September 14 than they were on Friday September 7.
This report is free to anyone who wants it, so please tell your friends. They can sign up at: http://alphaim.net/signup.html. If it is not for you, reply with REMOVE in the subject line.
Gordon Harms produces a Power Point for our local timing group meetings. You can get a copy of that at: http://www.stockmarket-ta.com/.


