


Last time the Bank of Japan raised 0.25% of its benchmark interest rate to 0.50% on 2/21/2007, the unwinding of the Yen Carry Trade took the S&P 500 Index and the Nasdaq down 6% and 7.5%, respectively, in just 8 trading sessions. As much as the BOJ would like to start normalizing interest rates, it had learned its lesson from the last rate hike and decided to keep the rate unchanged at the end of a 2-day monetary policy board meeting on 10/11/2007. So, traders continue to borrow Japanese yen at low interest rate to buy high yielding Dollar denominated U.S. Treasuries and equities. And, the Japanese yen remains to be the weaker currency against the falling Dollar as the rising Dollar to Yen exchange rate (USDJPY on Chart 1 below) continues to mimic the S&P 500 Index's (SPX) performance.
Although the spread between the SPX and the USDJPY had widened after, and before (in anticipation of), the Fed's rate cut on 9/18/2007 (gray area on Chart 1), the daily rate of change of the SPX and the USDJPY continued to show very similar patterns. I use 11-day SMA to smooth out the curves. The Fed's rate cut gave the stock market (SPX - black curve) a boost, but it exerted pressure on the Dollar. The Dollar henceforth slumped to one record low after another. Fortunately, the anemic Japanese economy and its low interest rate had kept the yen falling at a faster pace than the Dollar. The rising Dollar to yen exchange rate (USDJPY), and thus the rising carry trade, eventually narrowed the spread on 10/5/2007, when the SPX set a new intraday high (red arrow). For now, the lucid uptrend of the USDJPY depicted by the dotted blue line seems to support the growth of the yen carry trade. However, this uptrend, as well as the market's uptrend, may come upon some critical tests in the following weeks.

Chart 1
One critical test is whether the yen carry trade could reverse the falling SPX daily rate of change (see black curve on Chart 1 above). While the S&P 500 Index had just made record high, its daily percent price change had dropped off significantly. This gives the black curve the appearance of a market top.
Another test should come next week when the USDJPY bumps right up to the critical resistance level of the Fibonacci 50% retracement at approx. 117.85 (see Chart 2 below). Although 50% is not a Fibonacci Ratio, it does seem to function quite well as an important technical resistance/support gauge. This 50% retracement at 117.85 was also where the stock market started its second leg down during the July-August market correction (see red arrow). This was a strong support level then. But, when it collapsed in August, it cut right through the 38.2% retracement level (116.34) and dropped all the way to the 14-month low of 111.57 on 8/16/2007, which coincided with the recent market bottom. This previous strong support may now become just as strong a new resistance level. If the USDJPY failed to advance from here, it could retreat to approx. 116.34. And, if it dropped below this 38.2% retracement, it could spell big trouble.

Chart 2
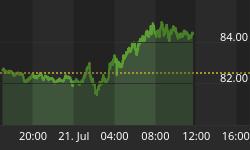
Cross referencing with the lone action of the Japanese Yen Index further validates this likely scenario. Chart 3 below shows that the Yen Index had also just declined to the critical support level at approx. 85 (each Japanese yen can be exchanged for $0.0085 US Dollar). This was the prior critical resistance. The yen broke loose from here on 8/15/2007 and jumped 5% in just 2 days. The yen dashed almost straight up to above 89 on 8/16/2007, the day the S&P 500 hit rock bottom. This type of impressive run-up solidified 85 as a strong support for the yen. And, the 12-day ROC (Rate of Change) of the Yen Index almost guarantees an imminent rebound from here. Whenever the ROC fell below minus 2 (see red circles in the upper pane of Chart 3), the Yen Index always bounced right back (red arrows). The yen's rebound is bearish not only for the yen carry trade but also for the exporting country like Japan.

Chart 3
The near perfect mirror image shown in Chart 4 below leaves little doubt that the yen (gray curve) and the Japanese stock market move in opposite directions. That's one heck of an incentive to depress the yen and the interest rates. In any case, just like the USDJPY and the Yen Index, the Tokyo Nikkei Average Index had also arrived at a critical juncture near 17,500. This was where the Nikkei took a nose dive on 7/27/2007 (see blue line on Chart 4 below). 17,500 has now become an important resistance that most Japanese traders are keeping an eye on.
From the candlestick analysis perspective, the last 2 candlesticks on Chart 4 form a Harami bearish reversal pattern. Harami pattern is not a very reliable reversal pattern, but tonight's Nikkei action (Monday in Japan) could provide further clarification. If the Nikkei closed lower tonight and the low fell below Friday's low of 17,280.60, then we'd have a highly reliable Three Inside Down candlestick confirmation of a bearish reversal. Nikkei opened higher tonight, but it's falling fast. At the time of my writing, it's now fallen below Friday's mid-point of 17,361.18.

Chart 4
This may turn out to be a pivotal week for these technical developments to unravel. It does look like the yen carry trade has quite a few roadblocks to clear. And, it may not have what it takes to labor through these barriers.


