


With the major U.S. stock indexes hitting lower lows in September, the market now has hit successively lower lows in seven of the first nine months in 2002 (January, February, April, May, June, July, and September). This is consistent with the forecast we made at the beginning of this year1 that the stock market, in the waterfall pattern that is characteristic of the final stage of bear markets, would hit a lower low almost every month this year until the bottom of the current bear market is reached sometime around the mid-term Congressional elections in November.

You will recall that at the beginning of the year, our view was in sharp contrast to the bullish consensus, which expected that what we have termed the "Post-9/11 Policymaking Intervention Rally" would become a new and sustainable bull market. They were wrong. Predictably, their bullishness has persisted throughout the decline, as they repeatedly believe the market has bottomed with every bear-market rally. This has resulted in an unusually long, drawn-out market decline, lasting 30 months to date. The average length of the 36 most severe bear markets since 1870 is only about 18 months (see Exhibit A in our July-August 2002 commentary). The severity of this bear market - that is, the combination of length and magnitude of the decline - is yet another confirmation that we have entered the deflationary Supercycle bear market period2 we have been forecasting.
As we have explained in previous commentaries, the geometry of a bear market, especially in its final "capitulation" stage, is like a ball bouncing downstairs (see chart). Each bounce off a lower step is larger than the bounce off the step before, but the direction is still downward, with the ball hitting lower lows until the bottom is reached. In the stock market, each decline to a lower level induces more investors to sell more, if not all, of their stocks, depressing stock prices further, until investors become completely disillusioned with stocks and dump their remaining holdings indiscriminately, sending stock prices plummeting to extremely low valuations by historical standards.
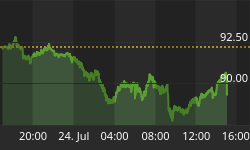
Investors have lost a lot of money by repeatedly mistaking the numerous bear-market rallies as starts of a new bull market and buying stocks, only to be whipsawed each time the market decline resumes. For example, after the biggest daily percentage gain in the Dow Jones Industrial Average since 1987 in the snapback rally on July 24, the market has once again reversed and is now declining to lower lows (see chart).
We expect such volatility to continue to increase dramatically, with more days during which downside volume exceeds 90% of total trading volume, until this Super-cycle bear market period reaches its ultimate low. Not only will daily swings of hundreds of points in the Dow Jones Industrial Average become even more common, but we are even prepared for a possible intra-day decline of 1,000 Dow points in the selling climax that will end this bear market.
The technology-dominated NASDAQ Composite Index, which led the market to the upside during the late-1990s mania, continues to lead the market to the downside, having cumulatively dropped in half twice (down more than 75%) from its record high and hitting six-year lows. (We note that the NASDAQ's counterpart in Germany is being closed and merged out of existence, after losing 96% of its value from its mania peak!) Most of the other major U.S. indexes have declined at least to four-year lows. Overall, some $8 trillion has been lost in the U.S. stock market since its March 2000 peak.
As the chart on page 1 shows, both the capitalization-weighted3 and equally-weighted4 indexes of all 6,500+ exchange-traded U.S. common stocks remain in confirmed downtrends well below their respective March 2000 and April 1998 highs. What's more, the indexes have sustainably underperformed money market funds for even longer - since 7/16/99 and 10/7/97, respectively, which were their asset-allocation highs with regard to money market funds. Only strategies for making money in up and down markets have beaten the performance of money markets over the past six years, and will continue to do so by a wide margin until the end of this Supercycle bear market period 12 years (plus or minus 4 years) from now.
Despite substantial - and in some cases, staggering - losses from this bear market, most investors continue to buy and hold stocks. The Supercycle bull market period from 1982-97(99) rewarded investors who bought on the dips and held their stocks, and the decline to date has not yet convinced them that their strategy is wrong. Supporting their view, a large majority of Wall Street strategists, portfolio managers, and advisory newsletters also are still bullish, asserting that the worst of the decline is over and that a new bull market is imminent - just as they have claimed repeatedly during the past 30 months of market decline.
This net bullish sentiment on the part of investors, investment strategists, and advisory newsletters is one of many factors pointing to a continuation of the current decline. A bear-market bottom is only reached when investors exhibit extreme pessimism and disillusionment with stocks by "throwing in the towel," usually by selling their stocks en masse in an indiscriminate selling panic. During the severe bear market in 1973-74, bearish sentiment among advisory newsletters rose above 50% for 28 weeks. So far this year, there has not been even one week with a bearish majority of advisory newsletters.
We began to see evidence of such capitulation in the June-July decline. We continue to expect significantly lower lows before this bear market ends - lows so low that 2002 will almost certainly be the fourth5 consecutive calendar year of negative returns for the stock market for the first time since the Great Depression years of 1929-32 during the previous Supercycle bear market period.
Already, the just completed third quarter was the worst-performing quarter since the 1987 Crash and the worst-performing third quarter in more than 50 years. The first three quarters of this year were the worst-performing since the 1929-32 Crash, and it is the first time two consecutive quarters posted double-digit losses since then. The current bear market is now the second largest in terms of percentage decline, the fourth longest, and the most severe (combining length with percentage decline) since reliable historical records began in 1870. We fully anticipated a market decline of this severity in our year-end forecast (see our November-December 2001 commentary), and we continue to believe that the market decline will worsen substantially in the next few months.
The chart below is the updated version of the probable window of both time and price for the bottom of the current bear market, as suggested by the forecasting model developed by Bob Bronson, principal of Bronson Capital Markets Research, our investment strategist. As you can see, the current trend line of the market has entered the Bear-Market Bottom Attractor Window, meaning the market is now predictably on a path toward its final selling climax within that price-time window.

In designing the parameters for this window, Bob believes that the following dates all function as attractors for the timing of the bottom of the current bear market:
- August 14-November 30: Period for CEOs' personal certification of corporate earnings (see our discussion below).
- October 7: Historically, the central-tendency date around which bear-market lows tend to cluster (see Exhibit A in our January 2002 commentary).
- October 31: Mutual funds' deadline for tax-loss selling of securities.
- November 5: Election Day (see our discussion of how mid-term Congressional elections act as bear-market bottom attractors in our June 2002 commentary).
- November 6: Next scheduled meeting of the Fed Open Market Committee to discuss interest rates or other monetary interventions (although to get the added impact from the element of surprise, the Fed may act sooner, or in between scheduled meetings - especially if the stock market is collapsing).
- December 9: Historically, latest date for a bear-market low in previous four-year election cycles (see Exhibit A in our January 2002 commentary).
- December 31: Individuals' deadline for tax-loss selling of securities.
Bob expects that other, event-driven dates that will act as bear-market bottom attractors will very likely also emerge - and soon.
Note also that the ever steepening rates of decline in the three recent trend lines of the market indicate that we are more rapidly approaching the final selling climax of this bear market. Other stock markets around the world have also experienced steepening rates of decline, and are hitting multi-year lows, as they become ever more highly correlated with the U.S. stock market. In Europe, the British FTSE 100 index, the German DAX index, and the French CAC index have all hit six-year lows.
Japan's benchmark stock index, the Nikkei 225, still down 76% from its peak nearly 13 years ago, recently broke to new 19-year lows.6 That is, the Japanese stock market has had no net gain for 19 years! Japan is a perfect example of a deflationary Supercycle bear market period, and a precursor of what we expect for the U.S., though this notion is still widely rejected.7
This increasing global correlation is a necessary condition for the massive selling climax that we term a mass-correlation, hypervolatility, illiquidity event, or MCHVIE (pronounced mac-vee). Just as correlation is increasing, volatility is also increasing around the world - another essential component of a MCHVIE. The volatility of the U.S. stock market, typically measured by the VIX index, is on its way to new highs. By benchmarking correlation and volatility, we can track the progress of the MCHVIE that will most likely occur before year-end.
Bob's forecasting model suggests that aggressive and unexpected policymaker intervention could cut a selling panic short, just as it did following 9/11 last year, thus pushing the bear-market bottom back, even to after Election Day on November 5. An example might be a larger-than-expected interest-rate cut by the Federal Reserve Board, especially in between its regularly scheduled meetings, and/or any other surprise action from their cache of intervention tools. However, unless such intervention is extremely well-timed, accidentally or otherwise, and therefore successful in signaling the end of the bear market, such actions would merely postpone once again the inevitable selling climax necessary to complete the current bear market and to set up a sustainable bull market.
Evidence That Corporate Earnings Are Weakening
Disappointment over ongoing signs of weakness in U.S. corporate earnings predictably has continued to plague the stock market. Note that expectations for corporate earnings are the single most important factor in determining stock prices, especially for institutional investors (banks and trust companies, pension plans, insurance companies, corporations, mutual funds, etc.), who constitute some 90% of the stock market's daily trading volume.
Direct evidence of deteriorating earnings is coming from Corporate America itself in the increasing number of companies warning that their revenues and earnings in the third quarter will fall short of expectations. Profit warnings, or so-called "negative preannouncements," are running 28% higher for the third quarter than for the second quarter. Prices of the individual stocks involved plunge on the release of such news - another sign that the bear market still has further to go to correct the overvaluation that remains priced into the market. The constant drumbeat of negative news about earnings has dragged the overall market substantially lower in recent weeks, and we fully expect this to continue until capitulation occurs.
Uncertainty about the quality and reliability of the earnings that are reported also continues to overhang the market. In addition to distress about the extent to which accounting manipulation and financial engineering have inflated corporate earnings in recent years,8 investors have specific concerns relating to a couple of hundred of the largest, publicly-traded U.S. corporations. These companies did not have to meet the initial August 14 deadline for submitting to the Securities and Exchange Commission financial statements that are personally certified by their CEOs as true and accurate. These companies have their own deadlines within the next two months.
Until these certified results are submitted, we do not know how many more companies are being forced to substantially lower, or restate, their revenues and earnings. The certification process has acted like an amnesty, giving corporations - in many cases, headed by new management teams - an opportunity to come clean on past, "creative" accounting without much risk of penalty. This certification also has functioned as a bearish-event attractor in setting up the bottom of the current bear market (see above for additional attractors).
Keep in mind also that over time, the reporting of earnings cycles from extreme exaggeration on the upside to extreme exaggeration on the downside. That is, manage-ments sometimes are actually motivated to take all possible write-offs and to make earnings look as bad as possible, which is a necessary and sufficient condition for a sustainable bull market.
There are many reasons for this. Poor earnings create a lower base for better comparisons in the future - that is, it is easier to have a bigger percentage gain from a lower earnings figure. This better comparison makes it easier for management - especially a new team - to look good, thus qualifying management for more performance-based awards of stock and stock options. After lower reported earnings drive stock prices down, stock options can be re-priced to lower levels, dramatically increasing their profit potential for management in the future, when earnings and stock prices recover from the depressed levels management arranged. These incentives for downplaying earnings are not yet priced into the stock market.
Bullishly-biased Wall Street analysts remain largely in denial about the profits disaster that continues to unfold, continuing to look for a sharp, V-shaped recovery in earnings, just as they did in vain in 2000 and 2001 - years when we were forecasting a continued decline in earnings.
At the beginning of this year, bottom-up analysts9 were expecting profits to rise 34% in 2002, with the second half even stronger than the first half, as they anticipated a broadening of the economic expansion. As recently as six months ago, Wall Street analysts still were forecasting a sharp 20% rise in earnings for the companies of the
S&P 500 index for the just ended third quarter. More recently, that consensus dropped to a rise of just 8.5%, with some analysts worrying that the gain could be even less.
In contrast, at the beginning of the year we forecasted that gains in earnings would be quite modest in 2002, with year-over-year and consecutive quarter comparisons weaker in the second half of the year than the first half, consistent with our forecast of a weakening economy (see further discussion below), led now by a pullback in consumer spending. Remember that the first-half strength in the economy was the direct result of the massive, post-9/11 monetary and fiscal intervention, but that effect has been waning.
As we wrote in our July-August 2002 commentary, the overall year-to-date earnings picture for U.S. corporations is mixed. Different methods for measuring earnings give different results.
According to Generally Accepted Accounting Procedures (GAAP) "as reported net income (earnings) per share" (EPS), profits for the S&P 500 companies have declined by 53% since their peak in the third quarter of 2001 - the biggest decline in corporate earnings since the Great Depression (see the red line in the chart below). This drop erased all profit gains since mid-1994. With the price of the S&P 500 index still nearly double its 1994 lows, only another 50% drop in the stock market will bring stock prices down to a level commensurate with the drop in this particular measure of earnings. So far this year, the four-quarter moving average of GAAP earnings was flat in the first quarter, rose modestly in the second quarter, and shows every indication of declining again in the third quarter.

Instead of using GAAP-reported earnings, Wall Street analysts generally prefer to use much more subjective, and currently grossly inflated, "operating earnings," which treat write-offs as one-time events that can be completely ignored, thus putting a better face on current earnings and setting up more favorable future earnings comparisons. Operating earnings for the companies in the S&P 500 index have recently been running about 55% higher than GAAP-reported earnings (see the green line in the chart on page 8) - a totally unrealistic and unsustainable differential.
As the chart on page 8 shows, operating EPS for the S&P 500 companies historically has run no more than $5 per share higher than GAAP-reported EPS, and we would expect the current outsized gap to close, bringing operating earnings significantly lower. Note also in that chart that even operating earnings have dropped 33% from their peak, and have recovered only slightly in the first and second quarter of 2002. We expect operating earnings to turn down again, and for the differential between operating EPS and GAAP-reported EPS to close to less than $5, which is both reasonable and historically sustainable. At that point, earnings expectations will have declined sufficiently for the prospect of recovering earnings next year to support a sustainable bull market.
Wall Street analysts, however, are reluctant to give up on their long-cherished idea that earnings should be sharply rebounding to former levels of profitability. They are still in denial over the loss of more than $100 billion in earnings that will not be recreated or restored because of changes in accounting rules and other cyclical changes. For example, the exaggerated pooling-of-interest benefits from mergers and acquisitions have been eliminated; employee stock option costs now must be included in corporate expenses; and because of the downturn in the stock market, the profits from pension plans, which have been booked as income in recent years, now have been replaced with roughly equivalent pension-funding costs.
So bullishly-biased analysts instead are seizing on a measure of profits used by economists, which has put earnings in the most favorable light over the past three quarters. "Economic profits" is a measure prepared by the Commerce Department's Bureau of Economic Analysis, using the aggregated National Income and Product Accounts (NIPA). This measure of earnings has declined much less than GAAP-reported and operating earnings since their respective peaks (see the blue line in the chart on page 10, which shows the dollar earnings of the three measures under discussion). This is primarily due to a one-time retroactive depreciation tax credit of about $40 billion in the fourth quarter of 2001 - one of the many monetary and fiscal intervention measures instituted after 9/11 that we anticipated in our October 2001 commentary.
This one-time tax benefit is not available to bolster either GAAP-reported or operating earnings, and it is misleading to use the economic profits measure without adjusting it for this windfall. When the benefit of this one-time tax event is removed, even NIPA economic profits have fallen to 1996 levels, as the chart on page 10 shows.
Although the four-quarter moving average in the chart below does not yet clearly show it, NIPA economic profits declined by 1.7% in both the first and second quarters. We fully expect that this measure of corporate profits will continue to deteriorate, especially on a year-over-year basis, during the second half of this year. The simultaneous downturn in all three of measures of earnings discussed above will dispel any remaining institutional investor bullishness with regard to an imminent rebound in earnings.

Any way you look at it, the economic rebound following the post-9/11 policymaking intervention is fading, and Corporate America knows it - even if Wall Street analysts aren't admitting it yet. Not only are companies publicly lowering their revenue and earnings projections, but they have stopped restocking inventories in recognition of the emerging slowdown in consumer spending; have continued to postpone new business investment; have been forced to lower prices and offer financing incentives for their products and services; are having difficulty servicing their debt; and are continuing to lay off workers. This is hardly the recipe for a sustained economic recovery or a sharp rebound in corporate earnings.
For years, Bob Bronson has rigorously tracked the opinions of Wall Street analysts and strategists as a very important contrarian indicator for the stock market. Another necessary condition for the end of this bear market is Wall Street analysts abandoning their hope of an immediate, V-shaped economic recovery and issuing lowered earnings expectations.
We believe that as third-quarter corporate profits come in weaker than expected - even when compared to the 9/11-devastated earnings of the third quarter of 2001, investors' growing realization that their profits expectations are way off the mark will accelerate the selling of equities across the board, plunging the stock market to significant new lows in the coming weeks and months. Investors abandoning hope of a sustainable economic recovery and bull stock market will result in the final selling washout - the massive, indiscriminate selling frenzy that we expect to become a mass-correlation, hypervolatility, illiquidity event, or MCHVIE - that will bring the current bear market to an end and set the stage for the considerable bull market to follow.
Further Evidence That Economic Activity Is Slowing To A Crawl
Leading economic indicators, including the single most important one - the stock market - suggest that the business-cycle contraction is not over, and that the post-9/11 economic rebound is now failing - badly. The rebound was largely driven by businesses rebuilding their inventories from low levels. But that rebound is now reversing, as overly indebted consumers are joining businesses in cutting back on their spending. The financial media has not caught on yet to this development.
As you can see from the chart below of data from the Economic Cycle Research Institute's (ECRI) Weekly Leading Index10 of U.S. economic activity, the index peaked at the end of May and began to decline, suggesting that the post-9/11 economic rebound
also would be breaking down. Recall that an index of leading economic indicators typically "forecasts" the economy about two quarters in advance. The index has continued to decline, and after a brief plateau, the decline is again accelerating.

The chart below shows the same ECRI data as the previous chart (the red line), along with Bob Bronson's modification of that data (the blue line). His modification substitutes the broader and more representative Wilshire Total Market Index, which includes the technology-dominated NASDAQ index,11 for the more limited New York Stock Exchange Composite Index as a component in the index. While the decline of both versions of the index has accelerated in recent weeks, note that Bob's more sensitive and accurate modified index, which peaked 2½ months earlier than the unmodified index
(giving us more advanced predictive value), has already dropped to a level that has wiped out, or retraced, all the gains in the index from the rebound after 9/11. This suggests that all gains in economic activity since the 9/11 rebound will be more than completely reversed as the U.S. economy heads back into contraction.
Thus, the most massive policymaker intervention in U.S. history - in terms of both the number and degree of the interventions - has failed to spark either a sustainable economic recovery or a new bull stock market. We anticipated just this outcome in our October 2001 commentary. We believed then, as we believe now, that such measures merely began to chip away at the massive excesses in the economy and financial systems that built up over the past decade or so - excesses that will take years to be purged.
Accordingly, recessions - and the bear stock markets that anticipate them - will be more frequent and severe than their long-term average, while the economic expansions - and the bull markets that anticipate them - will be correspondingly weaker. These are defining characteristics of a Supercycle bear market period. We continue to believe that the eventual consensus realization of this will lead to massive investor pessimism towards the stock market and, as a result, a dramatic selling climax to the current bear market, clearing the way for the start of the next bull market.
Regrettably, the U.S. slipping back into recession is very bad news for the rest of the world. America has been the growth engine of the world economy since replacing Japan in that role in the very early 1990s. The U.S. has accounted for about 40% of the increase in world GDP in recent years. Early signs of economic recovery in Europe, Japan, and other parts of Asia are rapidly fading, since limited domestic demand in these parts of the world leaves them particularly vulnerable to a U.S.-led slowdown in global trade.
What's more, the U.S. economy is likely to have a long, slow recovery. American households and businesses are carrying extreme, record levels of debt, which must be worked down. This makes further binge spending and investment less likely in the near future, despite the attraction of low interest rates. Additionally, with the stock market at lower levels, and with the prospect of declining home prices and home equity,12 Americans are feeling less wealthy (the so-called "negative wealth effect"), which also will cause them to spend less and save more.
In particular, the huge Baby Boomer segment of the population is rapidly approaching retirement, which is forcing them to reduce their spending drastically, as well as to increase their savings by spending less than they earn. We have been forecasting a rise in the all-important U.S. income-based savings rate from its recent record low level. Americans currently have the lowest savings rate among all developed nations.
With slow growth on the horizon for the U.S., once the multiple dips of the current, grinding economic contraction are behind us, the outlook for the rest of the world is equally lackluster for the foreseeable future. These are classic economic consequences of a deflationary Supercycle bear market period.
Cisco Systems: Update On A Fallen Star
We have tracked for some time the fall from grace of the stock of Cisco Systems, a company that manufactures computer network products. The darling of institutional investors during the stock market mania, it was at one time the world's largest company. Though IF&M does not generally comment on individual stocks, we have referred to Cisco in the context of its leadership in both the market mania and the subsequent collapse of the technology sector.
Cisco's use of accounting manipulation and financial engineering to pump up its reported earnings was representative of the root problem of the overvaluation of technology stocks as a whole. It engaged in both excessive use of non-expensed executive stock options and pooling-of-interest accounting. It also invested in its customers to help keep them afloat, giving Cisco a double-risk exposure to these companies - that is, as customers and as investments. The company has had to set aside hundreds of millions of dollars in recent years to protect against losses from customers who cannot pay their bills and to cover losses in its investments in its customers.
As we wrote in our January 2001 commentary, we expected that Cisco would become the bad-boy poster child for the large-capitalization, high-tech sector it once commanded by dropping cumulatively in half at least three times, becoming a "triple halver" (-88%), if not a "quadruple halver (-93%).
Cisco's stock just broke below $10 per share. Having once traded as high as $82, the stock has now declined 88%, becoming the "triple halver" we forecasted. We believe that not only will Cisco likely become a "quadruple halver" by dropping in half again to $5 per share or less, but we even question whether the company will survive in its present form at all - at least under the present management.
Its loss of hundreds of billions of dollars in capitalization is a complete and utter repudiation of the supposed "New Economic Era," the mania-induced idea that technological innovation - and companies like Cisco - would guarantee continual productivity gains and, therefore, perpetual economic growth. That is, there would no longer be any contractions, or any business cycle at all. Though this concept obviously is, and always was, sheer nonsense, don't forget that it was discussed seriously on the front page of The Wall Street Journal at the height of the stock market mania.
In our September 1999 commentary, we wrote that the current Supercycle bear market period would debunk this particular myth once and for all. The resumption of the economic slowdown in at least a double-dip recession - with the next leg more severe than the first - should put the final nail in the coffin of this mania-driven fantasy.
1 Prior IF&M commentaries, which contain the record of IF&M's past forecasts, are available upon request. It should not be assumed that forecasts made in the future will be accurate or will equal the accuracy of past forecasts. Nothing herein should be construed as a recommendation or performance forecast of a specific security.
2 A Supercycle bear market period is a 12- to 20-year period of underperformance during which bear markets, anticipating economic recessions, typically are at least twice as frequent and twice as severe as their historical average. Such a period begins when the return on money markets sustainably exceeds the total return on equities, even before downside-volatility-risk is taken into account. Further details are found in our research paper, "Bronson Asset Allocation Cycles," available on request.
3 In a capitalization-weighted index, the performance of the largest companies influences the index in direct proportion to their greater size. It is represented in our chart by the capitalization-weighted Wilshire Total Market Index, which includes all exchange-traded U.S. common stocks. Popular indices such as the S&P 500, NYSE Composite, and NASDAQ are primarily capitalization-weighted.
4 In an equally-weighted (or unweighted) index, the performance of a large company stock carries only as much weight as that of a small company stock. The equally-weighted Value Line Geometric Index of 1,700-plus stocks, traded mainly on the New York Stock Exchange, is a reasonable proxy for an equally-weighted index of more than 6,500 U.S. common stocks currently traded on the three major U.S. stock exchanges. Since most investors buy stocks in roughly equal dollar amounts and periodically rebalance at least part of their portfolio in the same way, the performance of typical investors' well-diversified portfolios lies between the performances of the capitalization- and equally-weighted indices - usually much closer to the equally-weighted index.
5 The media will report that this is only the third year of negative returns for stocks, since the popular, price- and size-weighted stock indexes, like the Dow Jones Industrial Average and the S&P 500 index, posted positive performances in 1999. However, the broad stock market, as measured by the average stock and average, well-diversified stock portfolio, was down in 1999, so a negative performance in 2002 will make it the fourth consecutive calendar year. (Note that even in the S&P 500 index, more of its stock components declined than advanced in 1999.) The two previous times that this happened were in 1929-32 and 1893-96 - both during deflationary Supercycle bear market periods, so that four years of negative performance could be a distinguishing characteristic of Supercycle bear market periods.
6 Just before the peak in the Nikkei at around 40,000 on December 31, 1989, Bob Bronson forecasted that it would not only break below its 1984 lows at 10,000, but ultimately would fall below 8,000. Recently, the Nikkei broke below 9,000.
7 As we wrote in our June 2001 commentary, during deflationary economic eras and their associated Supercycle bear stock-market periods, low interest rates reflect the fundamental deflationary problem: lack of demand. They do not stimulate economic activity. In spite of interest rates of nearly 0% in Japan, a lack of business and consumer demand has persisted for the past 12 years, sending the country in and out of recession, preventing its stock market from recovering, and creating ongoing deflation. We believe conditions in the U.S. have been developing along these same lines. Just as Japan's stock-market and economic collapses in the 1920s preceded by about a decade the 1929-32 Crash and ensuing Great Depression in the 1930s in the U.S., we believe that Japan once again entered a deflationary Supercycle bear market period about a decade before the U.S.
8 We first warned about the extent to which such accounting practices were distorting reported earnings in our October 7, 1997 report, "The Case for the Third Supercycle Bear Market Period of the Century."
9 Bottom-up analysts forecast the earnings of the individual companies that they follow, as opposed to top-down analysts, like Bob Bronson, who use macro-economic analysis to make aggregate, "big picture" earnings and economic forecasts.
10 The ECRI's Weekly Leading Index is made up of seven components that lead economic up- and downturns, including money supply, equity and bond markets, jobless claims, and commodity prices.
11 Since the stock market is the single most reliable leading economic indicator, Bob believes that the ECRI's data becomes a far better economic forecasting tool with the inclusion of the NASDAQ index. Far from being just another index, the NASDAQ contains most of the high-tech, "New Era Economy" stocks that drove the recent stock market mania. Investors' dollars poured into these companies' private and public, initial and secondary, equity and debt offerings and created a massive ripple effect. It provided corporations with easy access to cash, which they used for increasingly imprudent capital-spending expansion; and it provided them with inflated stock - essentially "free money" - which they used instead of cash to pursue increasingly speculative and poorly conceived mergers and acquisitions, a strategy then thought superior to growing the company organically, "the old-fashioned way." This situation of excess capital precipitating malinvestment occurs at the end of every Supercycle bull market period. By far the worst malinvestment was concentrated in the NASDAQ companies. These same stocks are now leading the decline in the current bear market, which in turn is driving the economic recession. Thus, history - especially in recent years - shows that inclusion of the NASDAQ stocks in the stock-market component of the ECRI weekly leading index results in a more timely and reliable forecasting tool.
12 See our discussion of what we are calling the "Great American Home-Equity Bust" in our September 2001 commentary.


