


Dear Speculators,
It's been a bit of a bumpy ride in the stock market in 2007. Nevertheless our patience appears to have been rewarded as the Dynamic Trading System has garnered a 39% NET YEAR-TO-DATE PORTFOLIO GAIN for The Agile Trader's auto-traded futures account.
If you would like a free one-month trial to our futures service, which allows you to auto-trade our service through our auto-trade broker, just CLICK HERE, then click the red "subscribe" button, and use the coupon code provided for your FREE TRIAL.
This week we're having a look at the issues that are likely to affect how the market performs in the first quarter of next year.
As is the case with any big unwind of an important and overleveraged market, there is a reflexive aspect to the mortgage-finance bubble the popping of which now threatens to push the US economy into a recession.
Here's how it's working, as far as I can tell. Especially at the sub-prime level of lending, when credit has been extended too far the rate of defaults increases. That increased rate of default devalues the bonds into which these risky loans have been securitized. The devaluation of those assets forces write-downs on the books of corporations that are holding those bonds. So, because of complex regulations, those corporations either have to raise capital in order to keep those assets on their books (if they don't, they end up with the equivalent of margin calls as a function of the depreciation of the mortgage bonds -- just as, if you're long stocks on margin and those stocks decline in value, you might suffer a margin call), or else those corporations have to sell those bonds into an illiquid market at greatly reduced prices, thereby suffering crushing losses.
The losses and risks of losses force these (especially Financial) corporations to a) cut back on their lending practices and/or b) curtail their own business activities. Since money (credit) is one of the key substrates of economic growth in our capitalist world, a contraction of credit (decreased willingness of Financial companies to lend) generates great (and amplified) resonance throughout the broad economy. And, in over-simplified terms from thence emanates the increased risk of an economic slowdown.
Of course the sixty-four-bazillion-dollar question is just how relatively contained or widespread will be the resonances from the problems in the credit market. On the one hand the bulls are claiming that this is a Wall Street problem, not a Main Street problem. And relatively robust Personal Income, Consumption, and Wage data support that view (at least for the moment) as does robust GDP data for 3Q07 (+4.9% annualized real growth). On the other hand, though, the bears argue that the US consumer is tapped out, that too many are upside-down on their mortgages, that the jobs and consumption data are in the process of rolling over, and that it's only a matter of time (and not much of it) before repercussions of the problems being felt in the Financial sector (and especially in the short-term credit market) spread to the broad economy.
A couple of things seem pretty clear to me: first, that I haven't lived long enough to have enough experience to know whether the bulls or bears are right about just how far the ripples will spread from the credit market problem; second, that there's never been an economic cycle just like this one, so even the people who have lived long enough to know who's right are speculating at best.
Is the economy robust enough, and are policy-makers good enough at policy-making, to avert a bona fide catastrophe without severely exacerbating the underlying surfeit of credit and liquidity that created these problems in the first place? I could issue an opinion, but, if you keep an eye on the financial media, you know that the last thing anyone needs, is another opinion. What I can offer, though, are some suggestions about what to watch in order to glean some clues about what the markets are thinking and what they're more or less likely to do going forward.
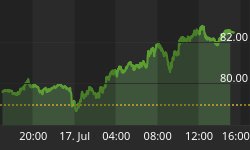
First of all, those mortgage bonds seem to have leveled off a bit. They don't seem to be going down in price so much anymore, and may indeed have begun some sort of rebound in earnest.
This recently issued tranche of Triple A mortgage bonds has remained above the neckline (red oblique line) of its Inverse Head & Shoulders bottom, on its way from a November low of 66.41 toward our target band of 80-82.

A break much below the 75 level (and especially back below the neckline around 73) would put prices at risk of further downside. And that would imply another difficult period for the Financials, as projected write-downs of depreciated assets would likely then be in the cards.
A move up to our target band would be near-term bullish for the Financial sector and for the broad market, and a move over 82 toward the 90 area would imply increasing levels of calm and perhaps ultimately lower mortgage default rates than have recently been feared.
The second chart I think it's wise to watch is the TED Spread: the difference between the 3-month London Inter-Bank Offer Rate (LIBOR) and the 3-month Treasury yield. The TED Spread has been wildly elevated lately, indicating extreme risk aversion in the short-term credit market. But the spread has recently been working its way a bit lower in response to global central banks' liquidity injections.
You can see on this next chart that the SPX (blue line) has had a strong inverse correlation (-0.45 since August 8) to the TED Spread (red line), and that its recent decline from around 2.2% to 1.86% has been associated with a constructive year-end recovery in the stock market.

Now, the interesting things to my eye on these 2 charts are , a) is just how far the TED Spread still has to fall in order to be back in a normal sub-1% range, and b) how much appreciation the mortgage bonds have to enjoy before they're back into better-than distressed range (say, above 90 on the ABX chart above). And by comparison, how relatively close to an all-time high is the SPX, now at 1484, and only about 5% below its all-time closing high.
Since hitting a local closing low in November that tested the August low down near 1400 the SPX has recovered almost exactly half of its October-November decline, and now sits almost precisely where it was before the Fed's first rate cut on September 18, just below key resistance at 1492.

This kind of triangular action is a great Rorshach Test, that gives the market and its participants time to build up strong opinions about which way it will break before reaching its apex (off to the right of what's visible on this chart).
In searching for clues on the next important direction (and keep in mind that the SPX hit 1460 last February, so, net net, the index is up only 25 points in the past 10 months) it may be important to look inside the market at what its various component sectors have been up to over the past number of months.
There are several interesting things we can see on this next scatter chart, which plots the SPX and its 10 sector Exchange Traded Funds (ETFs), each as a diamond-shaped spot on the chart.. On the horizontal (X) axis we see each sector ETF's beta (a measure of volatility relative to the market). On the vertical axis we see where each ETF is trading in its 110-trading-day range (which looks back to the July '07 high).
Low-beta ETFs are farther to the left with high-beta ETFs farther to the right. ETFs trading low in their 110-trading-day (that have not rallied much up off the recent lows) are trading farther down on the vertical axis with ETFS that are high in their range higher up on the vertical axis.

So, for instance, XLE has a Range Location of 1.0, which means that it's at the top of its range -- it closed Friday at a new high. XLY, by contrast has a Range Location of 0.04, which means its close on Friday represented just a 4% retracement of its decline from its 110-day high.
Now, what I find really interesting is that there is a -0.427 correlation in this series between the Range Location and Beta. That means that the low-beta ETFs are generally trading higher on the vertical axis and the high-beta sectors are generally trading lower on the vertical axis. This inverse correlation is represented by the fact that the blue oblique line, which is the best linear description of the trend in the data, travels from the upper left to the lower right (northwest to southeast). And if we remove the Energy (XLE) and Materials (XLB) sectors, then the inverse correlation between beta and Range Location becomes an even stronger -0.68. The trend ex Energy and Materials is represented by the red oblique line, and shows a steeper inverse correlation between beta and performance. Energy and Materials are the leading high-beta sectors---the ones bucking the trend.)
What does this inverse beta/Range Location trend reveal? Well, when the SPX is breaking out to the upside with some real "juice" behind it, as it did, say, in November, 2005, there's a tendency for the high-beta sectors to move higher more aggressively than the low-beta sectors, which in turn creates a positive correlation between beta and Range Location. (The best-fit linear trendline would move southwest to northeast rather than norwest to southeast.) When the SPX is not establishing such a positive correlation between beta and Range Location (when defensive names are leading), then there may be a tendency for the market to fail in its efforts to break to new highs.
So, going forward, if the market continues to work higher, we want to watch the beta/Range Location relationship to see if it's improving (becoming more positive, which would be bullish) or if it remains negative (bearish).
4-YEAR CYCLE
Checking in on our 4-year cycle work, the SPX once again has averted disaster…at least for the moment.

The index has once again bounced off a test of its -1 Standard Deviation line, which keeps it inside the "normal" envelope.
The current cycle continues to underperform the average cycle, but that may continue to be a function of the fact that the dip into the July '06 low from which the cycle was launched, was extraordinarily shallow relative to historical norms.
At this point, though, the -1SD line will be rising steadily for 3+ months, so the SPX is going to have to generally work its way higher or it will be in danger of issuing an important warning signal that a 4-year cyclical top may have formed this past October.
EARNINGS
The earnings picture continues to look wobbly for the SPX.

The uptrend in the consensus for forward 52-wk operating earnings per share on the index (F52W EPS, blue line) has given up its uptrend and has fallen by about 1.8% from its all-time high. Trailing Operating EPS (T52W EPS, yellow line) has dropped by about 4.1% from its high. And Reported EPS (pink line) has fallen about 9.2%, hit especially hard by write-downs of securitized mortgage bonds in the Financial sector. These write-downs have widened the gap between Operating and Reported earnings; this gap is our proxy for the quality of earnings, and when it widens, the market's credulity tends to get stretched, keeping risk premiums elevated.
It will take time to shrink the widened gap between the pink and yellow lines again. And likewise it will take time to restore investors' confidence again and to shrink risk premiums in various markets back to normal size.
For the moment, the negative momentum in Financial sector earnings estimates continues unabated.

As you can see on this chart, estimates for 4Q07 in Financials (yellow line) continue their free-fall.
For the moment, the decline in earnings estimates remains contained to this sector, however.

The other 9 sectors have continued to show a marked lack of deterioration in the consensus estimate for next year.
Should this relative degree of stability in the consensus sustain itself, then there's a good probability that the stock market will climb to new highs in 1H08. And if money wants back into the Financials, then 1Q08 in stocks could see a bona fide melt-up toward what had been our year-end SPX target band of 1600-1650.
But we do want to remain vigilant in terms of monitoring whether a negative financial contagion spreads to the non-financial sectors -- especially in their earnings estimates.
So, what do we have our eyes peeled for as we head into 2008?
- We're watching the mark-to-market prices on mortgage bonds (using the ABX chart above).
- We're watching the TED Spread for signs of easing strain in the credit markets.
- We're watching for whether high-beta stocks can resume leadership.
- We're watching for whether the SPX can sustain itself within the "normal" range of its 4-year cycle performance.
- And, finally, we're watching for stabilization in Financial-sector earnings estimates.
Of course there are other important things to watch this coming year: the price of oil, the price of gold, the rate of inflation, interest rates, the yield curve, money-supply growth, the presidential election, employment, broad earnings and economic growth, the US dollar, and the euro/yen cross, among others. But we'll try to focus most especially on the 5 points above over the few months to gauge how the market's immediate issues are evolving.
If you would like a free one-month trial to our futures service, which allows you to auto-trade our service through our auto-trade broker, (+39% year-to-date) just CLICK HERE, then click the red"subscribe" button, and use the coupon code provided for your FREE TRIAL.
Best regards and Happy Holidays!


