


LET'S LOOK AT THE S&P 500 INDEX- DAILY CHART

Last week I said not to be too impressed by my picking the date for the last low because there was a strong probability the rally would only be a multi-day counter trend. The index has rallied only one day and started down. If that is a valid one day counter trend up from the "obvious" support of the August low and not strong enough to even reach the previous support level, it leaves the downtrend in a very strong position to continue. I just published my 2008 forecast and it calls for a first quarter low that is followed by a strong rally. The key to the this year is what occurs this week and next. If the index follows the 10 and 50 year cycles there will be a low now or just marginally lower and a huge rally will occur. I doubt those cycles are dominant. The years 1978, 1968, 1948 and 1938 all had highs in the first few day of January and sold down into February or March lows. If the index follows the important 30 year, 40 year and important 60 year and 70 year cycles it will capitulate down below the August low and find a low around February 9th or out as far as March. There is a small chance of a low the 25th of this month but that would take a specific pattern of trend to confirm that possibility. It looks like running down into February is more likely.
The forecast and how it was calculated can only be found in the subscribers section.
LET'S TAKE A LOOK AT THE WEEKLY CHART

I put this chart up November 9th on this show when I forecasted the index would need to break the August low to find a solid low. I've drawn in the price movement since that time and these are the possible price objectives for this decline. Getting a 20 to 25% decline would be very abnormal for this period when considering the long term cycles but it cannot be ruled out. Again it depends up the pattern of trending the next week.
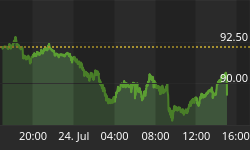
LET'S TAKE A QUICK LOOK AT CRUDE OIL

I wasn't watching crude the last four weeks due to working on the 2008 forecast for stocks. But had I been I'd be short now. As I'm sure your regular views know all markets vibrate in "time" to very specific cycles or blocks in time. Ninety calendar days is the normal timing for a blowoff or exhaustion of a trend and that appears to the probability for crude oil. The 90 day exhausted was followed by a 135 day marginal new high to help cement the possible top. A test of the 87.5 level will be very instructive. If there is a bounce of only one to four days from that "obvious" support the trend could be down. If not it is likely sideways. This market has a history of struggling upward for lengthy periods of time to put in a top. With the exhaustion cycle in place it could be different this instance. The next 45 increment in time is February 18 at 180 days from low and will be worth monitoring and could be another high or top.


