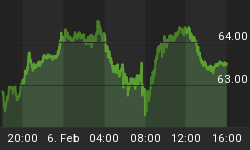
This week we're looking at some short-term patterns for trading this volatile market, starting with the hourly chart on the S&P 500 Depository Receipts (SPY), as of just before Friday's close.
The last four Friday's were down, but this one -- after the FOMC cut and some pretty strong stair-step action off of the 1/22 low at 125.36 -- exhibited a bid all day, and should break the back of the negative end-of-week psychology. At this juncture, the SPY is poised to continue higher towards a confrontation with key resistance at 142.00-143.00.

Moving over to the Nasdaq, increasingly the pattern that the Q's (QQQQ) have carved out off of the 11/23 low at 41.62 has the look of a countertrend "swing" move that points to a target in the vicinity of 47.60-.90 in the upcoming trading hours. At this juncture only a decline that violates key support at 44.95 will neutralize my current outlook.


