


LET'S LOOK AT THE S&P 500 DAILY CHART

Last week I indicated the index would find a high between the 7th to 10th trading day and the high was the 9th trading day. I said the high would be around 1385 and it spike to 10 points higher to 1395 for the top. Because the index couldn't reach the November low, turned down within the time window of 7 to 10 days, only moved marginally above calculated resistance and didn't reach the trendline all indicate the downtrend is still intact. My forecast calls for the index to either struggle down from this high and show a higher low or break to a marginal new low. If there is no new low within 11 trading days after this high then a higher low is likely. But because of the exhaustion low in January if a new low is hit it will have a strong probability of being a marginal new low around 1260 rather than another big leg down. If I'm wrong then it will fall to 1206 to 1216. Most world stock indexes are in the same position.
LET'S LOOK AT CRUDE OIL

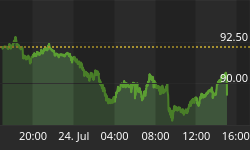
The CNBC Powerlunch report on January 16th I said oil had just put in a short term top and would go down to test the November low and bounce up from that "obvious" support. If that bounce was only 1 to 4 days it could indicate an intermediate term top may be in place. The rally has been 5 days and that is close enough but the move down since that 5 day rally has been struggling and if the trend is down it needs to break those lows now, in the next few days. I still believe the time period around the 18th of February could be important if the pattern of trending justifies it. For instance if the market doesn't break from here and struggles back up into the 18th and doesn't get above the high of the 30th of January. Or better yet if it is at that price level then that pattern and time would represent a strong probability for top.
LET'S TAKE A LOOK AT COPPER

In November last year on this show I said Copper had topped and wouldn't find low until early January and it came in late December, close. It was then to go into an intermediate term counter trend of 45, 60 or 90 calendar days and is behaving exactly as the forecast. This is a weak move up after hitting calculated support and this rally looks like it could be a complete intermediate term counter trend. I was looking for a marginally higher high above the January high but three days ago the market hit 45 calendar days and 45 points up and that is a possible time window to set up a top. If that time period is correct then the market should now resume the downtrend and the next rally should not exceed 4 trading days.


