


2/8/2008 7:43:13 PM
Our services' net portfolio gain for 2007 was 107.8%! For a full break up of this performance, CLICK HERE.
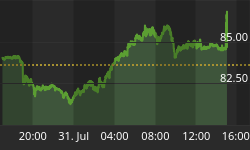
Support.
Our system remains in Sell mode. The market is at a support point and is now consolidating.
Current Position:
On January 17th we sold an SPX Feb 1280(SZPNP)/1270(SZPNN) Put Option Spread for a net credit of $1.50.
(i.e. a total premium received of $150 per $1,000 of margin)
SPX Chart - Bigger Picture

We seem to be in a sideways consolidation pattern between 1320 and 1380 roughly. My guess is that the market is digesting the fundamental issues of the last few weeks before deciding which way it will go.
SPX Chart - Shorter Picture

In the shorter term we seem to be forming a symmetrical triangle that currently sits between 1325 and 1375. This past week the 1320 level held, which is positive. For next week, as long as the triangle pattern holds, we should see a move to the 1360 level. A close above 1375 would be a bullish move whereas a close below 1325 would be bearish.
From the perspective of our 1280/1270 February put spread position, we're still in a delicate period. While there are some encouraging signs, during options expiry week anything can happen. As long as 1325 can hold on a closing basis, we should do well. In any event, we'll probably look to close this position around mid week and prepare for our March position.
This week's quote is from Albert Schweitzer, "An optimist is a person who sees a green light everywhere, while the pessimist sees only the red stoplight. The truly wise person is color-blind."
Have a great weekend and feel free to email me at angelo@stockbarometer.com with any questions or comments.


