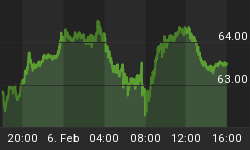
LET'S LOOK AT THE S&P DAILY CHART

Last week (22nd) we looked at the pattern of trending and cycles. There was a cycle for low on the 22nd and if the index could drop down to 1330 on Friday or Monday it would indicate a low for a multi week rally of some sort. It dropped down on Friday and hit 1327 and reversed, that was close enough. I couldn't qualify the significance of the low or the magnitude of the rally and I still can't but there are a few things that are bullish. The first was the forecast for 2008 that called for a first quarter low and a strong rally and this could be that low. The next, as I pointed out last week, is consensus showed enough bearishness to set in a low of some sort and very important, there are now three downside tests above the exhaustion low.
Since the low came on a 30 day cycle low to low there could be some resistance in time today but that resistance would likely only be a consolidation of the move up. I feel confident there should be more than three days up to this rally. The next real important time window is the 8th of March if the index runs up into that date it would be at risk of ending the rally. If it drops down into that date it could indicate another low and the next high on March 23rd or even out to April 22nd. It does look like the minimum move will be out to around the 8th of March if it clears that date then the 23rd of March.
The price high for this rally is a guess for me at this time. There will be resistance at the price zone of previous high and the price of the November low. Moving above that price zone is very important on the weekly chart. Staying below that level keeps the downtrend in a strong technical position so this rally desperately needs to move above that resistance and it looks like it will. All I can say now is resistance above that level is 1325+-2 points. If it does exhaust up into 45 days we could see 1432 or even 1447 to 1450. I have to see a little more trading before forecasting price.
It would be bullish if the next move down can stay out of the little congestion it just moved out from. That would indicate a fast move up. The first part of this move up should be the fastest part of the leg even if the rally is a counter trend and only goes 45, 60 or 90 calendar days. A majority of the advance should come in the first half of the trend.
The banking system, in aggregate, is probably bankrupt. The rating agencies are holding the system together with bogus ratings of the monoline insurers. Every economic number looks worse than the previous. But that is how market consensus gets so bearish a rally can occur. There is a low of some significance in place and the index should rally into at least March 8th. The news gets worse every day but technically a good rally appears to be starting.


