


The term "fit the thread" before implied to pipefitters being able to fit pipes together by having the thread of the metal made properly. It has since been used to describe many things that seem to fit well. The title does not refer to buying clothing at the GAP to look good, but a piece on technical analysis regarding gaps that occur in daily stock market patterns, or intraday time frames. There are four types of gaps: a) common gap b) breakaway gap c) continuation gap and d) exhaustion gap.
A gap appears in an uptrend or downtrend when the prior days market action is above or below today's price, respectively, with no overlap of the prior candlesticks. A description of each type of gap is explained below, where they occur and how to identify them.
a) Common Gap - Common gaps occur in areas of congestion, or when prices move sideways. The prices will gap up or down and are filled quickly. No new highs or lows occur after the gap. A noticeable curl is observed when the gap closes is a key indication of this form of a gap. The average time for common gaps to fill is six days. When gaps in price occur, the volume is 135% of the average volume (defined as 25 day moving average of volume) the first day, to then decrease to around 90% of the average volume.
b) Breakaway Gap - A breakaway gap occurs near the start of a trend. The average rise in gaps appearing in up trends is 25%, and 20% for downtrends. The average number of days to the ultimate high or low is 77 and 52 days for up and down trends, respectively. High volume is a key indicator of breakaway gaps. The first day volume in up trends and down trends is 2x and 2.6x the average daily volume, respectively. The volume for the next five days should be around 1.5x the average volume. 76% and 66% of breakaway gaps for up trends and down trends are filled within the first year, respectively.
c) Continuation gaps are somewhat rare in occurrence, occurring near the middle of the trend. The average rise is around 11% for gaps in both up and down trends. The average time to hit the trend high or low for up trends and down trends is 14, and 11 days, respectively. Volume for up trends should be around 2.3x the average daily volume for the first day, decreasing to 1.3x five days past the gap. Nearly 90% of continuation gaps in up or down trends are filled within one year and take an average of 70 days to fill. Continuation gaps tend to mark the half way point of move, so the distance from the gap to the start of the trend can be slapped on upwards to project the top.
d) Exhaustion gaps tend to mark the end of the trend, and are not that common. The average rise or decline in up trends or down trends is 5%. Most of these gaps occur in the upper or lower third of the yearly price range for up trends or down trends, respectively. Volume on the first day of the gap is nearly triple the average daily volume, decreasing to near normal volume levels by the end of five more trading days. 98% of all exhaustion gaps are filled within one year, with the average time being around 20 days to close the gap.
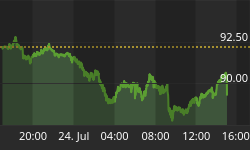
The best example of a breakaway gap and a continuation gap is in Cour d'Alene shown in chart below. A top near $3.90/share by the end of September could be expected on this basis.
Cour d'Alene chart with various stochastic settings.
This issue is a few days late due to the large volume of charts present. The XOI and XNG are thrown in to the mix this week, but with no Elliott Wave counts (nothing has changed, still correcting, and no time to make the charts) to help paint a picture as to where the economy is headed the next while and next year. The analysis presented in this issue is the US dollar index, Gold BUGS Index, S&P 500 Index, Natural Gas Index, and the Oil Index. Charts were analyzed on Saturday and Sunday, but still have the trends valid as described. I will not be doing another issue until September 14th. I am going to be reading over my Elliott Wave text more closely and take a breather.
US Dollar Index
The first figure shows weekly USD with Bollinger Bands (BB) and full stochastics set at 55,21,34. The upper BB's are still in ribbon formation, suggesting that the trend down is still in place until they come closer together. The 3x2 Gann fan-line will be the new support line for the USD. The stochastics have turned up, but weekly stochastics will stay at the base of the channel for long periods of time. Examination of sloping patterns in the trend (see downward sloped line in red) will be indicative of a change in the trend at some point in the future. The second figure shows the daily USD with BB's and full stochastics set at 55,21,34. The upper BB's are tight still, with the lower BB's having 1 ½ to 2 months of consolidation prior to initiation of the next leg down, as shown with the converging lines drawn in. The full stochastics are nearing the top of the channel and can be expected to begin curling over prior to a crossover of %K (faster line), and %D (slower line) signaling a sell signal.
Figure 1: Weekly USD chart with Bollinger Bands and Full Stochastics.
Figure 2: Daily USD chart with Bollinger Bands and Full Stochastics.
Figure 3 shows the longer term Elliott wave count of the USD Index. Shorter-term stochastics have the USD set to decline for 2-3 weeks (the way it is being whipped around right now, who knows). The preferred count is shown in color and the alternate is shown in gray. Pending on the length of the wave that develops, we could have completed one third of the pattern, or we are nearing completion of the last third of the pattern. The green line is a thought as to how the pattern may develop, based upon what we are seeing. The full stochastics have risen sharply with no pullback, so the proposed topping out in the middle of October is still on. However, if the pattern does continue, then the decline might not occur until a bit later. With a Presidential cycle well under way, a decline now, rather than later would be better for it and the markets. Figure 4 show the shorter term Elliott Wave counts of the USD Index. Numerous possibilities exist for labeling this, and the red line shown for the thought path is that the current portion of the pattern is forming a zigzag. The rise could extend to 99.5 to 100 (slightly beyond). The pattern is thought to be complete some time by the middle to latter portion of October. It is highly probable that the entire pattern presented is one leg of a flat (3-3-5), with a decline to follow, and one more upleg.
Figure 3: USD Index longer term Elliott Wave count.
Figure 4: USD Index shorter term Elliott Wave count.
AMEX Gold BUGS Index (HUI)
Figure 5 shows the weekly HUI with Bollinger bands and full stochastics set at 89,21,55. The lower BB's indicate another ribbon formation is about to be forming. When the lower 34 (blue) and 55 (green) MA BB lines come close to each other, that will be a sign that a top is close to being put in. The upper BB's are getting nearer to spreading out a bit, which will be another indication of a top. The full stochastics has nice lower trendline support currently for the uptrend. The daily HUI pattern with BB's and full stochastics is shown in Figure 6. The lower BB's are forming an extension of the ribbon pattern and full stochastics are still rising, albeit slower now. Before BB's will issue a sell signal, the lower 21day MA BB line should go horizontal and cross over the blue line with the upper BB's spreading out.
Figure 5: Weekly HUI with Bollinger Bands and Full Stochastics.
Figure 6: Daily HUI with Bollinger Bands and Full Stochastics.
The longer term Elliott wave count of the HUI is shown in Figure 7. Figure 8 is the shorter term EW count, putting an upward target of 268 for the current advance in the pattern. This would concur with wave (5) of intermediate degree being more than 1.618x longer than wave (3). This pattern has a price objective with an etched in time objective. Combinations of the indicators should provide ample information as to when the top was put in. I prefer to wait until the confirmation of the top is in rather than try and second-guess it. The good news is that when wave [1] of primary degree completes (may require to raise the to cycle degree), there will be chances for those who did not enter the gold bull to do so at lower prices during wave [2]'s retracement. The end of this move is 2-3 months from now, but should be prepared for quicker moves pending the nature of the market. Of interest in Figure 8, wave 1 = 42 price units and wave 2 - 48 price units. Usually the extended wave of an impulse will extend in price by 1.618x(most frequent), time, or complexity (increased numbers of subwaves within the pattern). Two of the three above must occur for an impulse pattern to be valid. Based upon the assumption wave 5 will extend by 1.618x that of wave 3 minimally, a top of around 268 is calculated. Wave 1 was extended in price and time so far, so that should be viewed that the pattern could also complete any time (highly unlikely though if wave 5 is going to go much higher). The drop from last week did not occur, so the pattern had the degrees within the wave raised one notch. The super bullish count is that wave 3 is actually wave [iii].3, meaning we are going to 300 plus. I am sticking with the more conservative count for now, but be aware of the mega bullish possibility.
Figure 7: HUI Longer Term Elliott Wave Count.
Figure 8: HUI Shorter Term Elliott Wave Count.
S&P 500 Index
Figure 9 shows the weekly S&P 500 chart with Bollinger Bands, and full stochastics set at 55,21,34. Bollinger bands are suggestive of one little bit of downside prior to the upside move expected in 2004. Full stochastics are in an upward trend, suggestive that any declines will not reverse the market strength. The daily S&P chart is shown in Figure 10. Full stochastics issued a sell signal one month ago, and is currently just a negative divergence of the trend. The BB's are currently tight, with a similar setup shown between the two red circles. Today I was examining the stochastics at 14,3,3 and they are turning up, and the close above 1020 confirmed this. The S&P could rise up to 1050 at this point, but moves beyond will require a lot of market strength. A move to this level does not harm any analysis presented up till now.
Figure 9: Weekly S&P 500 Index with Bollinger Bands and Full Stochastics.
Figure 10: Daily S&P 500 Index with Bollinger Bands and Full Stochastics. 
This is where Elliott Wave analysis comes in very handy for aiding in determining how the pattern of a wave should terminate. The longer term pattern (Figure 11) shows completion should be done by September at the latest (mid-October may be a target pending how long the move for completion takes. Figure 12 shows the shorter-term count. The alternate count presented last week turned out to be the correct count. The fifth wave was extended and was not fully retraced. Wave [i] is likely to be the extended wave of the pattern (50-point move). Waves [iii], and [v] to follow have a chance to move up to 1050-1060. After this completes, the pattern should be finished, and we start the decline phase. The 2-4 trendline is very important for determining the end of a pattern. When it is broken by wave 5 in an equivalent or shorter period of time that it took to form, the pattern of one degree higher is complete. Wave 3 as seen was extended in price, time and complexity, fully meeting an impulsive wave patterns requirements. The longer-term pattern as shown in Figure 11 is likely that we are completing wave (C ).{A], or the first leg of a flat pattern. Refer back to 03/08/13 issue for price targets for the wave up anticipated after the coming decline.
Figure 11: S&P 500 Index Longer Term Elliott Wave Count.
Figure 12. S&P 500 Index Shorter Term Elliott Wave Count.
Natural Gas Index (XNG)
It has been awhile since I have looked at the natural gas index. The weekly chart shown in Figure 13 has BB's and full stochastics set at 55,13,55. The lower BB's show the upward trend is still in force with confirmation with the stochastics. The trend may take years to resolve itself before becoming bearish. Figure 14 shows the daily natural gas index Bollinger Bands are tightening up, and stochastics are deciding what to do. A crossover appears eminent which would be a good buy signal for re-entry into stocks. The EW count is simple here, still in wave (2) or [2] pending the degree one is labeling it at.
Figure 13: XNG Weekly Chart with Bollinger Bands and Full Stochastics.
Figure 14: XNG Daily Chart with Bollinger Bands and Full Stochastics.
Oil Index (XOI)
Been awhile for this index also (no EW counts). The XOI was in a very complex corrective pattern from 1998 till currently. The weekly chart shown in Figure 15 shows the BB's and full stochastics set at 55,13,34. The BB's appear to be setting up for a longer term upward move, confirmed by the stochastics having a bullish crossover of the %K and %D lines. The daily chart shown in Figure 16 has the lower BB's compressed together in a horizontal plane, which usually signifies a move in the opposite direction it came from, in this instance upwards. The stochastics are suggestive of more downside. Examination of the wave structure has the current wave (2) still in progress in wave B right now (bow appear as a 3-3-5 move for A and B). The coming move should be an impulsive decline.
Figure 15: XOI Weekly Chart with Bollinger bands and Full Stochastics
Figure 16: XOI Daily Chart
Summary
Natural Gas and Oil prices are probably going to be going much higher during the coming years, which will prevent the stock markets from having strong gains like the 90's. It appears that inflation is the sign of the times right now rather than deflation. Gold has finally broken out of its linkage to currencies as seen by its rising prices with a rising US dollar.
The USD Index has 1 ½ to 2 months prior to having a decline lasting until December 2003 to March 2004. After that, a substantial rally is expected for retracing the move down since the 120 peak. A decline in the USD is expected to start later this week to early next week lasting up to 3 weeks during which gold should have a nice advancement.
There have been some indicators and items suggestive that the gold and HUI tops may be sooner than December 2003, although pretty much everything I follow suggests otherwise. The Cour d,Alene chart shows a top is expected by the end of this month. Now that stock could stay toppy for up to one month or more, or may even go beyond the $3.90 level. The HUI as a whole is expected to hit around 268 +/- 10 points based upon impulsive wave structure criteria. A strong rally in the markets and USD could bode bad news for gold and gold shares next year. When wave [1] of this pattern complete, it would be normal for wave [2] to retrace by 38.2 to 50%, and up to 61.8%.
The S&P 500 confirmed the Dowse higher high place a few weeks ago. The market structure now has the S&P set to march up to 1050-1060 to complete the structure. If there is a lot of squeezes here, the decline could be offset to mid-October.
It will be interesting to see how all things work out here. Each indice will have their own pulse, own characteristics, which may have periods of high correlation's with other indices. These will oscillate in and out of favor, so it is best to examine each indice as a separate entity for the most accurate results in technical analysis.
Off for a week and a half. Have fun.


